SHALLOW WATER MULTIBEAM ECHOSOUNDING IN JAPAN HYDROGRAPHIC DEPARTMENTYoshihiro MATSUMOTO, Shoichi KOKUTA, Hirokazu MORI and Hiroyuki YAMANO, JapanAdditional paper- not presented at the conference, included only in the proceedings. Key words: multibeam echosounding, hydrographic survey, bathymetry, nautical chart. PRESENT SITUATION OF SHALLOW WATER MULTIBEAM ECHOSOUNDERS IN JHDIn F.Y.1999 JHD obtained three more multibeam echosounders for shallow water (RESON SEABAT 8101: 210kHz, 150°swath). These echosounders are expected to be used on the 20m-type survey vessels (HAMASHIO, UZUSHIO, and ISOSHIO) belong to HDs of 3rd, 5th and 10th Regional C. G. Hqs., and installation of them is now under way. As a result, each 20m-type survey vessel (6 deployed) comes to have her own multibeam echosounder on her under-hull. Now we are on the stage that we have to use them for practical hydrographic survey to get valid soundings for nautical chart. For this purpose, guidelines for survey and data processing have been designed mainly by regional HDs. In this paper we would like to introduce our hydrographic survey systems and review practical operations of them.
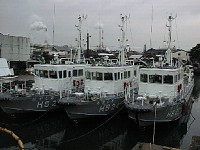
Pic.1 Newly-built 20m-type survey vessels INSTRUMENTSOn each 20m-type survey vessel of JHD, a multibeam echosounder SEABAT 8101, RTK-OTF GPS receivers MS750, a motion sensor DMS-10 and a GPS gyro NR230mkII are installed, and data acquisition software HYPACK on a windows PC records data from these devices. In addition, a sound velocimeter SVPS is prepared in order to make sound velocity correction on the sounding data. The multibeam echosounder SEABAT 8101 is installed on the under-hull of the vessel. It transmits 240 kHz acoustic pulse waves at most 30 times a second, and outputs real-time bathymetric data shallower than 400m depth. It forms 101 beams with 1.5°x1.5° footprint within maximum 150° swath, and outputs sounding data of high resolution and high accuracy. The motion sensor DMS-10 outputs attitude of survey vessel i.e. heave, roll and pitch data for correction of soundings. The accuracy is 0.1° for roll and pitch, and the larger hand of 5cm or 5% for heave at 0.05-10Hz frequency. The sound velocimeter SVPS directly measures accurate sound velocity and pressure of water shallower than 100m. The data acquisition software HYPACK operates data acquisition and guiding of the vessel on LCD, and furthermore offers sweep editor, sorting and plotting programs.
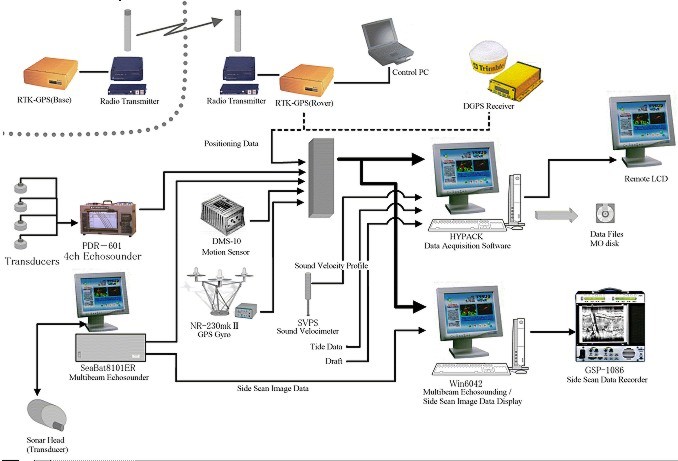
Fig.1 Block diagram of hydrographic data acquisition system. SURVEYS BY MULTIBEAM ECHOSOUNDERSHere we describe some tips required for efficient and precise hydrographic survey with multibeam echosounders (Mori et al., 2000). (1) Sandy or muddy areaMore slanted beams sometimes returns irregular soundings, since they are more refracted by sound velocity distribution, and their footprints become larger. If unsounded width is planned in advance, many supplement surveys will be required later when irregular soundings exist at the edge of the swath. To avoid such inefficiency, sandy or muddy area less than 30m depth should be planned to ensonify 100%. (2) Rocky areaMultibeam echosounding is efficient to grasp distribution and shape of rocks. Thus supplement surveys are much reduced. But in order to distinguish peaks from noises and to ensonify shaded zones behind shallows, swathes from adjacent survey lines should be enough overlapped (Fig.2a).
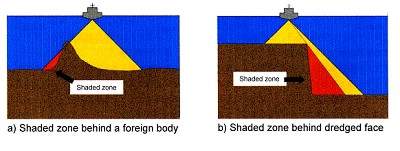
Fig.2 Attentions to multibeam echosoundings over cheracteristic features. (3) ObstructionsAs a whole, same consideration as for rocky area is required. When fish heavens or rocks lie on sandy or muddy shallow water (less than 4m from the sonar head), sometimes soundings are dropped (because of high contrast of reflection intensity) or second echo is recorded. Adjustment of sensitivity could handle this problem, but in worse cases doubled surveys are required: first sensitive for bottom and second for obstructions. (4) Dredged areaIn case we miss foreign bodies, adjacent swathes should be enough overlapped. Since dredged face sometimes can shades dredged bottom (Fig.2b), we should plan such survey lines that can ensonify the face and inside dredged area (Fig.2c). Same way is applicable to the case of wharf frontage. It is important to clear the face of wharf and pavings: while in traditional way with single beam echosounders survey lines were planned so as not to pick the face (Fig.2d). (5) Patch testIn order to obtain accurate soundings, it is required to compensate biases of motion sensor (roll, pitch, and yaw) and time latencies. Latency of a positioning device (especially RTK-GPS) is remarkable. Patch Test program in HYPACK is used for this purpose. When sonar head is permanently installed on the under-hull, changes of these biases are not expected to be large. It is recommended to set a fixed ' test area' around a specific topographic feature and to perform patch test in the same area every time. DATAPROCESSINGObtained data is transferred to a PC for processing by removable media, and is processed in a procedure listed below.
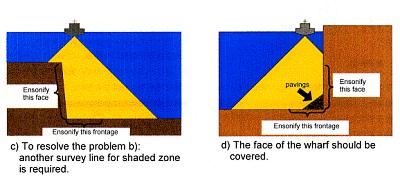
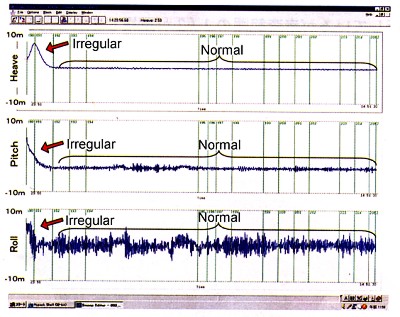
As all steps proceed in digital form from survey work to data processing, enormous data files require careful handling: unintended removal or damage of data files is fatal on data processing. Here we figure out the points to survey efficiently and to obtain valid soundings for nautical chart (Mori et al., 2000). (1) Checking irregular values of motion sensorIt is sometimes reported that motion sensors output irregular values in some condition. (Fig.3). In such cases, soundings are compensated wrongly; imaginary shallows may appear. To avoid this, it is important to check outputs of motion sensors and remove such irregularities.
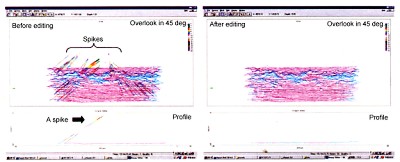
Fig.3 Records of a motion sensor (2) Removal of noises and consideration of shallowsAs reflection intensity is not accessible in digital soundings, it is difficult to distinguish noises and floats from true bottom. Spikes shown in Fig.4 (often caused by bubbles) are easy to remove. But where shallows such as fish heavens exists, their peaks are doubtful; floats or noises may cover their true bottom.
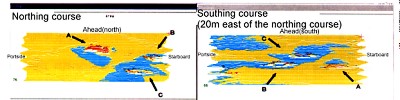
Fig.4 Removal of noises In such cases, it is required to cover the object by enough beams of different angle from adjacent survey lines and to check if same feature appears. For example, in the records of a survey line going to north (Fig.5), objects, probably fish heavens, appear at A (direct under) and B, C (starboard). In the next records going to south along the adjacent survey line, half of whose swath overlaps the previous one, A appears to the starboard and B and C appear direct under. By comparing their shapes, distribution and height we can distinguish noises from fish heavens. Where artificial features presumably exists such as dredged area or wharf frontage, same step is required.
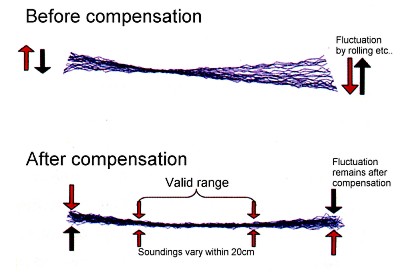
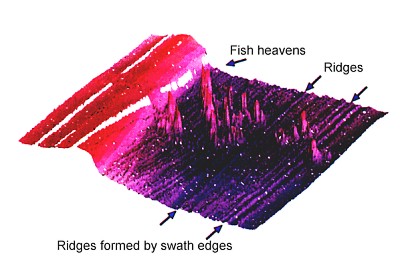
Fig.5 Comparison of records between adjacent survey lines (3) Valid sounding range in a swathSurvey work would get efficient and would take the least time, if all soundings in the swath were valid. As beams get slanted, deviation of soundings increases: as much as 1m at the edge (Fig.6). When all soundings are adopted and compiled, edge of the swath forms imaginary ridges (Fig.7). To avoid this, we need to limit range to adopt soundings in the swath. Permitted deviation of soundings is less than 20cm (±10cm) in flat area
Fig.6 Valid range to adopt soundings in the swath
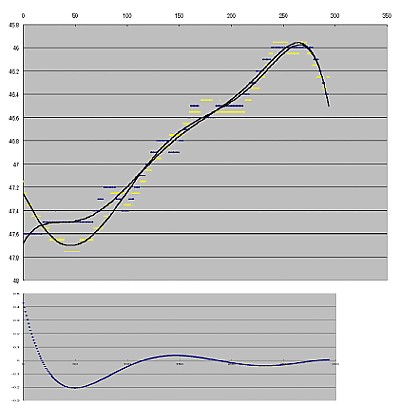
Fig.7 Whale-eye-view formed from multibeam sounding data Comparison between SEABAT8101 and conventional single beam echosounder is reported (Yamano, 2000). In this report, soundings by SEABAT8101(processed surface modeling) are compared with single beam soundings along a verification line orthogonal to the previous survey (consequently, along the direction of the swath of SEABAT)(Fig.8). This conclusion is that soundings within 65°angle can be adopted (Fig.9). PROBLEMS
Surveying with multibeam echo sounding is efficient, but on the other hand its enormous data takes too much time to process. More efficient multibeam editor is requested. In addition, detecting method of abnormal data should be developed.
Fig.8 Comparison of soundings acquired by multibeam and single beam echosounders.
Fig.9 Comparison of soundings acquired by multibeam and single beam echosounders. REFERENCESAsada, A., Kokuta, S., Matsumoto, Y., Masaoka, H. 1998. Bias Adjustment for Multi-beam Survey using SEABAT, Technical Bulletin on Hydrography, 16, 103-107, Japan Hydrographic Department, Tokyo (in Japanese) Mori, H., Yamamoto, T., Tedokon, I., 2000. Hydrographic Survey
using SEABAT, Technical Bulletin on Hydrography, 18, 1-7, Japan
Hydrographic Department, Tokyo (in Japanese) BIOGRAPHICAL NOTEYoshihiro Matsumoto has studied geophysics at the Kyoto University first at the Faculty of Science 1991-95 and then volcanology (Master's degree) at the Division of Earth and Planetary Sciences, Graduate School of Science 1995-97. From 1997 he has worked as Assistant Coastal Surveys Officer at the Coastal Surveys and Cartography Division, Hydrographic Department, Japan Coast Guard mainly engaged in technical support on hydrographic surveys He has following publications:
He is a member of the The Volcanological Society of Japan and Seismological Society of Japan. CONTACTYoshihiro Matsumoto and Shoichi Kokuta Hirokazu Mori 11 April 2001 This page is maintained by the FIG Office. Last revised on 15-03-16. |