

Article of the Month - September 2022 |
 |
 |
 |
 |
| Ion Anastasios Karolos | Stylianos Bitharis | Vasileios Tsioukas | Christos Pikridas |
 |
 |
 |
| Sotirios Kontogiannis | Theodosios Gkamas | Nikolaos Zinas |
This article in .pdf-format (24 pages)
The safety and enforcement of preventive maintenance procedures specifically for equipment in large industrial infrastructures is a matter of major importance in the Oil and Gas industry. Historically, industrial maintenance operations were executed only when strictly necessary. However, in industrial manufacturing environments, maintenance processes are stochastic, dynamic, and complex. Nowadays, the maintenance paradigm is changing, and industrial maintenance is now understood as a strategic factor and a profit contributor to ensuring productivity in industrial systems. An important parameter to satisfy this point is the production of digital twins, which can be derived through an accurate and detailed survey. This paper presents a holistic industry 4.0 solution towards industrial maintenance. The study focuses on the oil refinery industry and presents their proposed maintenance system architecture, system implementation, technical and basic functional characteristics. The current study took place at Hellenic Petroleum facilities in Northern Greece.
Daily management, or daily huddle, has been successfully used by many companies such as the oil and gas industry for their planning and follow-up of the daily operations. In addition, the methodology is often used in parts of the organization, company, or Industry. By visualizing work-hour plans of specific machines and having daily short meetings, a maintenance plan can be created and assigned, solving problems directly and steering the operations to be performed.
Traditional Industrial processes focus only on automation and isolated per machinery data collection. SCADA/DCS systems were the first critical step for process automation. In addition, the 4.0 roadmap enforces the use of centralized cloud storage of Industrial information and cloud computing processes, including data mining and machine learning algorithms. These processes will include all Industrial assets assisted by cloud-connected sensors and IIoT as well as Cyber-Physical Systems and 3D representations of physical objects called assets (Lampropoulos et. al., 2019).
Industrial IoT and machine learning focused on failure detection in production lines can be achieved by utilizing IoT concentrators for issuing real-time alerts and propagating sensory measurements, and using MQTT brokers over Industrial wireless communication technologies (Silvestri et. al., 2020), such as NBIoT, LTE, Industrial Wi-Fi, and LoRa (Nurelmadina et. al., 2021). Furthermore, the IoT integration can offer important features that can be exploited by machine learning algorithms included in orchestration frameworks similar to the one proposed by (Carvajal et. al., 2019).
Following this trend, Augmented Reality processes have also been
proposed to be incorporated as parts of the industrial maintenance and
training processes using mobile phone applications (De Pace et. al,
2018) and the utilization of optical see-through devices (Pierdicca
et.al., 2017). Such initiatives trigger the necessity of virtual
objects, the encapsulation of such objects with sensory measurements, as
well as the interoperability of such objects with management operations
directly provided from the field.
The increasing use of the Internet of Things (IoT) in factories, and the
AR advancements, where assets are connected to the Internet and extend
their use via the development of features, eventually leads to the use
of Virtual Reality (VR) for Industrial processes and machinery
maintenance training. Virtual Reality headsets provide an additional
capability for basic training recruits and Industrial problems
visualization and simulation (Liagkou et.al., 2019).
Nevertheless, significant challenges are still lying ahead, such as security and privacy, data heterogeneity, management of smart processes for optimal decisions, and standardization (Sanchez et. al, 2020). This paper uses as digital objects terrestrial 3D laser scanner surveys which took place at the Hellenic Petroleum facilities in Northern Greece. Digitizing the complex installations, with the use of IoT and cloud facility management processes, the Industry can increase the performance of the daily industrial management by adding digital features in 3D objects, like real-time indicators, pressure, temperature, and vibrations of a pump or compressor. Furthermore, the authors' proposed framework and system architecture, including the processes for Industrial maintenance, focusing on Oil industry infrastructures and assets, is presented.
Usually, all studies so far have kept "close" proprietary files and have been done using desktop tools easily leveraged to deceive an unsuspecting public. Therefore, the authors used a web tool for viewing the 3D survey in this study. Web service is a quick and easy way to share your point cloud data with anyone, regardless of their familiarity with 3D models. In addition, some of its features include distance & area measurements, height profiles, clip volumes, various point rendering qualities (square, circle, interpolation, splats), and different types of materials or characteristics. For that reason, the Potree Webtool (TU Wien, 2016, Schuetz, 2016, Carey et al., 2021) has been chosen. Potree is a free and open-source webGL based viewer for large point clouds, e.g., 20 billion and more. It is based on the TU Wien Scanopy project and several other research projects. Some of its features include distance & area measurements, height profiles, clip volumes, various point rendering qualities (square, circle, interpolation, splats), and different materials. The figure illustrates a screenshot from the Potree environment of a Continuous Catalytic Reforming (CCR) unit with the basic associated tools.
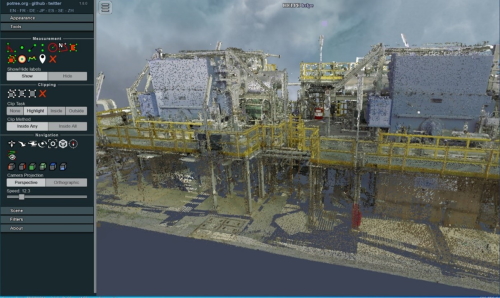 |
Figure 1. 3D point cloud view of a CCR unit using Potree environment
Industrial maintenance has evolved significantly towards digital transformation over the last few years. Historically, industrial maintenance operations were executed only when strictly necessary. However, in industrial manufacturing environments, maintenance processes are stochastic, dynamic, and chaotic. Industrial Maintenance processes are crucial issues that ensure production efficiency since unexpected disturbances lead to the loss of productivity. Therefore, maintenance acts mainly as reactive and preventive to avoid production disruption, being the predictive strategy only applied for critical situations.
Traditionally, maintenance strategies do not consider the huge amount of data generated and the available emergent Information and Communications Technology (ICT), e.g., Internet of Things (IoT), Big data, advanced data analytics, cloud computing, and augmented reality. However, the maintenance paradigm is changing, and industrial maintenance is now understood as a strategic factor and a profit contributor to ensuring productivity in industrial systems (Faccio et al., 2014). Furthermore, Industry scaled sensory data generation requires a different schemaless storage approach, different from the existing relational database solutions used by Industrial Management systems (Asiminidis et al., 2018).
In this paper, the authors provide a holistic solution industry 4.0 solution towards industrial maintenance. The authors focus on the Οil refinery industry maintenance and present their proposed management system architecture, system implementation, technical and functional characteristics in the following sections. Figure 1 illustrates the authors' proposed high-level system architecture.
Towards the direction of Industrial Maintenance and Industry 4.0, the authors propose a framework consisting of the following actions as part of their approach and methodology that ensembles their proposed system architecture:
Action 1: 3D Industrial models and 3D Industrial infrastructures representation. The 3D industrial assets and infrastructures representation over the cloud is a significant step for visualizing and monitoring personnel and assets. It leads to the enforcement of digital twins via implementing the Resources Management system and its accommodated services for data management and monitoring purposes. Additionally, the definition of access zones and the utilization of GPS/Indoor position technologies such as BLE and UWB will provide additional location-based services for both personnel and Industrial assets.
Action 2: Centralized and normalized maintenance processes. This action includes developing cloud services provided by a Resources Management system. This system includes processes and plans per machinery (asset), historical maintenance information, technical specifications, and guidelines for maintenance operations. It also interfaces with already stored Industrial parts per asset, personnel/assets tracking services, generate tasks, and issue alerts and notifications. In addition, the proposed system will be capable of interacting with mobile tablets and exchanging real-time information with the maintenance personnel in the field.
Action 3: Centralized assets sensory repository and machine learning processes. The proposed Resources Management System includes appropriate sensory storage engines, where all sensory information per asset is stored in real-time. Appropriate Industrial Wi-Fi/NBIoT/LoRa infrastructure, utilized to collect machinery data. The collected data are sent to the cloud logging service. Additionally, deep learning and data mining processes are utilized for monitoring and management purposes. Appropriate sensory data visualization is offered to the mobile end node devices (tablets) using secure transmission channels as part of asynchronous management or requested industrial maintenance tasks.
Action 4: Unified system including AR capabilities and VR training methods. Includes integrating the assets as objects rendered by mobile devices (tablets) and their provided AR capabilities to implement services such as 3D draw and send or 3D alerts illustration and 3D illustrative maintenance using 3D rendering and 3D annotation. Additionally, the use of pre-trained convolutional neural networks and image segmentation techniques will also be used as part of the assets or assets malfunction placement detection. Finally, VR technology is included as part of personnel facility guidance and training for specific Industrial maintenance operations.
Based on their framework proposition and methodology, the authors propose a new system for technical maintenance for the oil refinery industry. The main industrial parts applied to the proposition are flammable gas or liquid pumps and compressors. The proposed system is presented in Figure 2 and includes the following components:
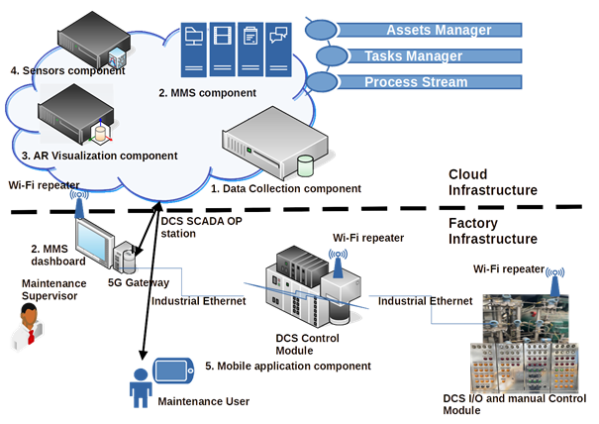 |
Figure 2. Proposed Maintenance system for Oil refinery industries high-level architecture
Data Collection component: Data collection component includes the cloud database engine for the MMS, the 3D point cloud data storage for the point cloud factory and assets visualization, and the NoSQL database for the collection of assets sensor measurements, divided per asset I.D. The data collection component also includes the agents and services for collecting, securing the data (data acquisition and logging services), and providing the data. Data acquisition for the MMS component for tasks and processes is performed over SSL HTTP POSTS (Kontogiannis and Asiminidis, 2021). Data acquisition for the personnel positioning service is performed using NodeJS HTTP over AES-128 encrypted data streams (Yassein et al., 2017, Profanter et al., 2019). Data acquisition for sensory data is performed via TLS-MQTT AES-128 and base64 encoded data streams. Finally, 3D A.R. annotated point cloud information is acquired using SSL DAV/ secure FTP services.
Maintenance Management System component: The MMS component is a cloud-based system that includes its relational Database such as PostgreSQL, SQL Server, or Oracle SQL. The Management system includes the logic and display functionality for periodic maintenance tasks and the steps to be followed per asset. The MMS component can provide via the Web: 1) pumps and compressors (called assets) categorization and assets description manager, 2) a historical assets maintenance information dashboard, 3) tasks and processes manager for the creation of tasks, 4) maintenance personnel manager for the process of tasks assignment, 5) automated digital forms creation for repair procedures and static digital forms for maintenance procedures, 6) procedures recording and forms logging functionality. Additionally, the MMS component should include a mobile tablet app for the issue of notifications/tasks and procedures reporting to the field engineers. Communication between the cloud Web platform and the mobile tablet app will be over secure 5G/6G cellular installations channels or the factory-protected Wi-Fi installation.
Factory AR visualization component: This component includes the appropriate point cloud 3D representation of the factory establishment with geofenced zones and on-demand assets 3D rendering at the mobile device end. The factory representation includes a Web-based 3D point cloud view of the factory, with geofenced and georeferenced ATEX zones (ATEX-137, 1992) and real-time marks of the personnel position in the point-cloud render. The positioning of the personnel is performed with the use of a positioning service installed at the personnel's mobile devices. This service transmits GPS positioning information for open area installations or BLE/UWB proximity information for indoor establishments (Karaagac et al., 2017, Schmidt et al., 2018). The factory A.R. component also includes the functionality of alerts generation for restricted zone access and the addition of sensory and informative augmented annotations to either the Stats Manager of the sensory component or the Tasks Manager of the MMS component. The Web-based 3D point cloud render of the compressor or pump also includes asset annotations, where maintenance process steps information is presented at the mobile device. Asset authentication is also available using Q.R. code scanning or asset image detection from the mobile device's camera.
Sensors component: Proposed maintenance systems sensors measurements stored by the Data collection component must be accessible to other processes, algorithms, and interfaces with other systems. In this case, data input comes from existing pump and compressor sensors, focusing on the authors' implementation for Oil refinery maintenance. Those sensors are mainly temperature, pressure, and vibration sensors. Using Profibus or Industrial Ethernet, these sensors measurements are concentrated at the Distributed Control System (DCS) operator station HMI from the assets (pumps or compressors) field control stations. Then from the operation station, the data are uploaded to a cloud-based MongoDB Database (Harrison and Harrison, 2021). This database acts as a centralized storage point offering statistical links for plotting and 3D annotating sensor measures to the point cloud Web component. The data collection component also includes agents and bots capable of issuing assets notifications regarding assets status and maintenance estimations. Such information is inferred using trained regressors, machine learning classifiers, or Recurrent Neural Networks (Tedjopurnomo et al., 2020, Bochie et al., 2021).
Mobile application component: The mobile application includes the services and activities for more timely and less error-prone asset maintenance tasks. It includes the Q.R. or asset A.R. asset detection, instance segmentation (Hayder et al., 2017, Zheng et al., 2021), or A.R. asset segmentation via point cloud group similarities (Wang et al., 2018). The MMS positioning service for indoor and outdoor installations. The MMS maintenance tasks alerts and notifications service and the A.R. visualization service provides real-time sensor data, statistical data, and maintenance process steps via assets annotation links (URLs) on top of point cloud layers. The following section gives detailed information regarding the proposed system components and functionality.
The detailed description of the proposed Industrial Maintenance system components is provided in the following subsections. At first, the MMS component, services, and functionality are outlined. Then the A.R. point-cloud visualization component is presented and its mobile phone interface. Finally, the sensors management component is presented, and the interoperability of the Q.R. asset detection with the presentation of real-time sensor asset measurements via point cloud annotations.
The purpose of the Industrial maintenance management system is to store information regarding assets and incorporate the digital twins of physical industrial assets to streamline the staff's predictive maintenance and daily operations. First, basic information such as name, type, serial number, manufacturer, and dimensions are recorded for each machinery (asset). The Industrial Maintenance system also has the capability of dynamic properties to cater to different asset categories' different needs. Then the schedule maintenance plan is created by uploading the relevant work orders and associated form templates for every inspection. When a scheduled maintenance work order needs to be performed, the assigned staff receives a notification regarding the forthcoming activity. An important part of the industrial maintenance system is its fault prediction of equipment parts ability, based on time-series sensory data analysis and visualization for specific metrics.
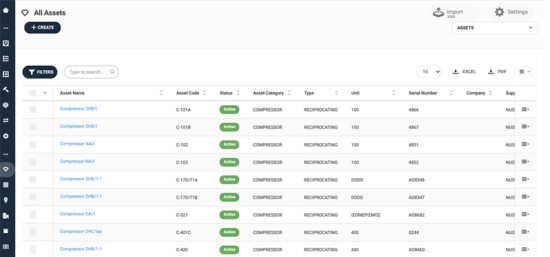 |
Figure 3. Recorded compressor assets in an Industrial maintenance system
In this study, the 3D point cloud of each survey has been extracted to a specific e57 format file, a compatible format for FARO SCENE lite viewer. Then, each derived point cloud was then transformed into a compatible virtual reality scene (see Figure 4), using the previously mentioned software package. Finally, the user can interact with each 3D object using the oculus Rift controllers and collect valuable asset information.
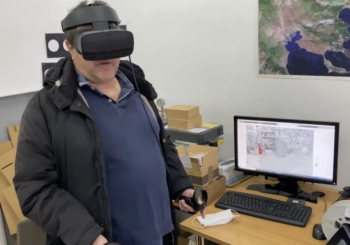 |
Figure 4. Virtual reality with Oculus Rift S during the survey of a compressor
The following figure (fig.5) illustrates the augmented reality smartphone application based on the marker (Q.R. code method) for object recognition and tracking. This smartphone app allows each user to monitor critical indicators during complex machinery operations (compressors or pumps).
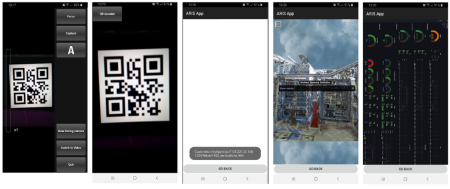 |
Figure 5. Android-based smartphone app using marker AR tracking
The sensors measurements component is the core component for data analysis and alerts prediction based on sensory input. It includes four major parts: 1) The sensory database interface that connects the sensors Measurements component to the data collection via appropriate JSON API, 2) The real-time and historical data representation called Stats Manager, based on Telegraf and Grafana (Kychkin et al., 2019), 3) and the raw data navigation and update called CRUD Manager for NoSQL data (Jawarneh et al., 2018) and 3) Intelligent Agent (IAgent), that traverses data via the JSON API providing assets predictions based on past sensory data. The Stats Manager can provide detailed sensory information per asset or sensor over time for interfacing with other systems and services. The CRUD Manager is equipped with a JSON API for remote requests over HTTP PUT or POST. Figure 6 illustrates the output of the Stats and CRUD manager for a specific compressor asset. Figure 6(1) shows the real-time sensory data representations via the CRUD Manager. In contrast, Figure 6(2) illustrates the compressor temperature measurements graph and compressor vibration X, Y, Z-axis graph measurements over time.
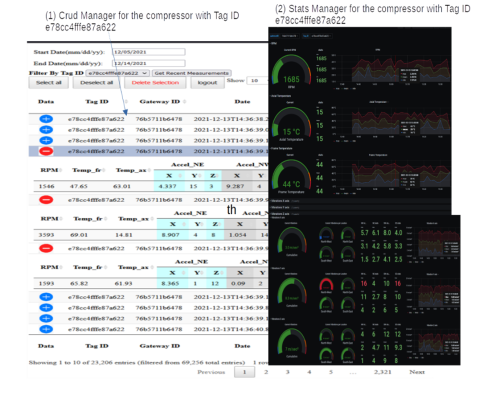 |
Figure 6. Compressor sensory component Stats Manager and CRUD Manager output
An important piece in this intelligent and predictive maintenance architecture is the decision support system for maintenance technicians during maintenance interventions. This smart decision support system, called IAgent, articulated with human-machine interaction technologies, e.g. augmented reality, contributes to a faster and more efficient reaction and recovery of the failure occurs when compared to paper procedures. Its core functionality is the deprivation of critical assets malfunctions by providing prior information using a per asset sensory equipped part predictions of probable malfunctions.
In order to achieve that, a set of past data is required per sensory asset part and alerts output issued for that part from the MMS component. The volume of data needed depends on the max frequency of the alerts monitored. For example, for sensory data stored per minute, ten monitor alert types, and a max frequency of once a week, at least 100,000 sensory data points are needed for classifier train in a supervised mode to provide accurate mapping to discrete alerts (Windeatt, 2008, Alsariera et al., 2020, Saha et al., 2021). For alerts issued for more complicated source inputs, meaning different asset sensory parts or sensory types are contributing to the issue of the alert, LSTM - RNNs are used to derive temporal patterns of prediction (Wang et al., 2020). The further enhancements and evaluation of these LSTMs using targeted compressors and their issued alerts are the authors' ongoing research.
Augmented Reality (A.R.) can reduce maintenance process time and improve quality by giving virtual information and assistance during maintenance tasks. A set of experiments has been performed at (Havard et al., 2016), showing -3% less maintenance time using tablets and -13% using A.R. glasses from the standard process of paper-based maintenance process performed with 25% fewer errors. Focusing on oil refinery maintenance, the use of mobile phones or tablets requires special mobile devices of appropriate safety regulations for zones of hazardous materials called ATEX zone classes, divisions, and zones (ATEX-137, 1992). The maintenance compressors placed in an oil refinery establishment follow Class 1/Division 2 Zone 2 ATEX directives for mobile phones (ATEX-114, 2014) that signify ignitable concentrations of flammable gasses, vapors, or liquids are in closed containers. Still, it is likely to be released for short periods under normal operating conditions.
This study presents a holistic Industry 4.0 solution towards industrial maintenance. It focuses on the oil refinery industry where complex machines installation exists. An important parameter that needs to be satisfied by the proposed framework is the production of digital twins, which can be derived through accurate and detailed survey campaigns. A digital twin is a virtual representation of a physical object or process. Implementing a VR-capable Industrial maintenance framework is essential because it allows analysis of the data and systems involved in a new concept before they can even happen. It is a bridge between the physical and digital worlds. The proposed by the authors' framework and system architecture under implementation is a step towards this direction of primarily unifying and automating the reporting maintenance processes and assets monitoring under a cloud platform that incorporates 3D assets visualization. Being at the forefront of technology, the Oil and gas industry already utilizes dynamic software models and can take advantage of this proposed concept to ensure efficient and safe ongoing operations and design new techniques and facilities. For example, replicating physical equipment or processes in a virtual environment can optimize asset and process improvements in the virtual world before applying them in the real one. This could be done by adding digital features like real-time indicators like a compressor's pressure, temperature, vibrations, as well as other maintenance actions that can trigger alert scenarios.
This research has been co-financed by the European Union and Greek national funds through the Operational Program Competitiveness, Entrepreneurship and Innovation, under the call RESEARCH – CREATE – INNOVATE (project code: T2EDK-00708). Mr N. Maroulas, Mr. G.Giougkis and Mr. D.Chrisikopoulos managing and technical staff of Hellenic Petroleum refinery are highly appreciated.
Ion-Anastasios Karolos, holds a diploma in Rural and Surveying Engineering (2012) and a Postgraduate Degree of Specialization in Geoinformatics (2015). From January 2016 until the present, is a Ph.D. Candidate in School of Rural and Surveying Engineering, Aristotle University of Thessaloniki. His research interest mainly focuses on hardware and software development of high precision GNSS receivers using technologies like PCB designing (embedded design), 3D printing, and smartphone applications. He is a member of the research project titled "Liver3D" (https://www.liver3d.com/) for 3D printing of human liver for medical purposes, co-funded by E.U. and National Funds. He has a lot of programming experience using various programming languages (Swift, Objective-C, Kotlin, Java, Python, C/C++) and software development kits (iOS SDK, Android SDK).
Stylianos Bitharis, holds an MSc degree in Geoinformatics with a specialization in Modern Geodetic applications and his Ph.D. at the Department of Geodesy and Surveying (Faculty of Engineering, School of Rural and Surveying Engineering) at the Aristotle University of Thessaloniki. His Ph.D. research is related to GNSS data analysis, Geodetic velocity estimation, and their implementation in Geodetic Reference Frames.
Vasileios Tsioukas, Professor in the Dept. of Geodesy and Surveying, School of Rural and Surveying Engineering, Aristotle University of Thessaloniki. Education: Ph.D. in digital Photogrammetry and Remote Sensing for the extraction of reliable geometric information from close-range, aerial, and satellite sensors (2000), B.Sc. in Electrical Engineering at the Aristotle University of Thessaloniki. He has served as an assistant professor in the Dept. of Architectural Engineering of the Democritus University of Thrace (2003-2011). Visiting Professor (2005-2021) in the Postgraduate Programme "Geoinformation in Environmental Management" at the Mediterranean Agronomic Institute of Chania. Scientific co-operator of the Cultural and Educational Technology Institute of Greece (CETI), since 2004. His research has focused on Terrestrial Laser Scanning, Mobil Mapping Systems, Photogrammetry and Remote Sensing for the determination of 3D models of Cultural heritage, Digital Terrain Models using stereoscopic aerial images and satellite SAR scenes for the generation of orthoimages and large (1:50) and small scale maps (1:50.000).
Christos Pikridas, Professor in the Dept. of Geodesy and Surveying, School of Rural and Surveying Engineering, Aristotle University of Thessaloniki. PhD in Satellite Geodesy by the same University. He is currently the Director of the Geodetic methods and Satellite Applications Lab. at the Department of Geodesy and Surveying of AUTh. He is an expert on GNSS data analysis. He has over 20 years of research experience on GNSS modeling error sources, algorithm development, quality check and specifications for permanent GNSS monitoring networks installation, GNSS applications in engineering projects, and natural disaster monitoring and management.
Sotirios Kontogiannis, graduated from the Democritus University of Thrace, Department of Electrical and Computer Engineering. He received a M.Sc. in Software Engineering and Ph.D. from the same department in the research area of algorithms and network protocols for Distributed systems. He is currently a scientific staff member and Director of the Distributed ΜicroComputer Systems Laboratory team MCSL at the Dept. of Mathematics, University of Ioannina
Theodosios Gkamas, received his B.Sc. and M.Sc. degrees in Computer Science from the University of Ioannina, Greece, in 2008 and 2010, respectively, while he obtained a Ph.D. degree in Signal and Image Processing from the University of Strasbourg, France, in 2015. He was a postdoctoral Researcher with CERTH-ITI in Thessaloniki during 2018-2019. In 2020, he started working as a Senior A.I. Researcher, Lead A.I. Software Engineer, and Project Manager at the Department of Mathematics in the University of Ioannina, Greece. His research interests mainly include Signal and Image Processing, Medical Image Analysis, Bioinformatics, Machine Learning, Deep Learning, Computer Vision, Pattern Recognition and their application to Medical/Biological Imaging, Industrial IoT sensory data, and financial data.
Nikolaos Zinas, holds a B.Sc. in surveying and Mapping sciences, Msc. in Geodetic survey and Space Geodesy from University of Nottingham and Ph.D. in Geomatic Engineering from UCL. He is the Managing Director at TEKMON P.C., a software company, building a digital workspace for the daily operations and critical communications of the desk-less workforce. He has over 10 years of experience, including general management and software product development from idea to commercialization.
CONTACTS
Karolos, Ion Anastasios,
School of Rural and Survey-ing Eng.,
The Aristotle University of Thessaloniki,
Greece
Stylianos Bitharis,
School of Rural and Survey-ing Eng.,
The Aristotle University of Thessaloniki,
Greece
Vasileios Tioukas,
School of Rural and Survey-ing Eng.,
The Aristotle University of Thessaloniki,
Greece
Christos Pikridas,
School of Rural and Survey-ing Eng.,
The Aristotle University of Thessaloniki,
Greece
Sotirios Kontogiannis,
Dept. of Mathematics, University of Ioannina
MicroComputer Systems Laboratory team
Ioannina
GREECE
Theodosios Gkamas,
Laboratory of Distributed MicroComputer Systems MCSL,
Dept. of Mathematics,
The University of Ioannina,
Greece
Nikolaos Zinas,
Tekmon IKE,
Ioannina,
Greece