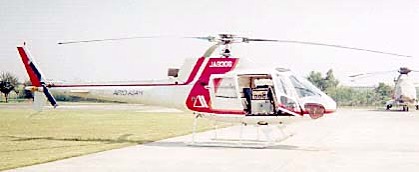
AIRBORNE LASER MEASUREMENT TECHNOLOGY IN JAPANTakayuki OKUBO, JapanKey words: GPS, Laser Profiling, Garbomirror scanner, CG, 3d-modeling. AbstractKinematics GPS and inertia movement instrumentation technology has developed rapidly, which achieved to provide a high and stable accuracy of spatial positioning, attitude in three dimensions for high-speed movement platform such as aircraft. The airborne laser measurement system which is based on the laser scanning technology, has been integrated to the GPS inertia movement instrument on the aircraft platform. The advantage of airborne laser data is the possibility of displaying, operating and generating of 3D spatial model in the computer. Further development is being done to extend to wide variety of applications in scientific manner. The applications based on these airborne laser data are used in the field of mapping, analysis of land deformations, city modeling, flood control simulation, and CG or virtual realities. Also, the research and development on spatial operation function technology for three-dimension spatial model acquired by airborne laser measurement system, is now applied for the expansion uses of latest 3D-GIS. The analysis result of the airborne laser measurement, by using the electronic ground control points as reference points, which is established by Geographical Survey Institute, extending over 1000 points in Japan, and the research result concerning the preparation of the manual for public survey, indicates the vision of the prospect of the laser measurement in Japan. 1. INTRODUCTIONAfter the Cold War, military affairs technologies were opened to private enterprises, which the technologies of laser scanner devices and the positioning system in high speed movement platform were able to be developed. Aero Asahi Corporation (AAC) has owned a fixed wing (Cessna207) and the helicopter (AS350), employed the airborne laser measurement system, ALTM 1025 that had been developed by Optech Inc. under our specifications, which generates a high dense DEM data in 3D. As a result, AAC was succeeded to expand the range of 3D data acquisition up to 25cm-30cm, comparing to 1m range in the year 1997. In the year 2000, the airborne laser measurement system (ALTM1225) has been integrated to mobilize with the digital CCD color camera, pixel size 2000x3000, which acquires the image simultaneously. The result from laser profile system shall be used as an exterior calibration parameter, to generate orthogonal image that synchronizes with the DEM data. Also, the reflection intensity data of each laser spot has potential uses for distinguishing the difference of materials. This report describes the outline of the airborne laser profile system and case studies about applications such as actual land surface analysis and others. 2. AIRBORNE LASER PROFILING(1) Airborne subsystem ALTM1025 had been developed in connection with survey work on obstacle tree felling ranges to power lines to detect the wire more than 10mm from a position above 150m and coniferous sharp tree tops without being left. The system is composed of an airborne measuring subsystem and a ground post-processing subsystem. Fig.1 shows the airborne subsystem, which is comprised of sensor head, computer and recorder racks, GPS receiver and power supply. Some devices are housed in sensor head such as laser transmitter and garbomirror scanner, position and orientation system (POS) sensor and CCD video camera. GPS antenna is laid on the roof. RTK navigation subsystem is loaded unconnected with ALTM subsystem, which is comprised of antennas and receivers of GPS and beacon, PC and display. And also the ground GPS are included for kinematic deferential processing by carrier phase.
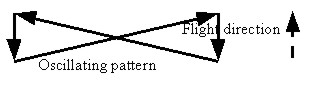
Fig.1 Airborne system GPS provides a long-term accuracy but sometimes interrupted by outage, multipath and nose in the short term. On the other, POS has a good accuracy in the short term but suffers from a long-term drift. This integrated positioning system provides a very good accuracy by compensating each other for their weakness. The garbomirror scanner oscillates in the two directions, flight path direction and its perpendicular, and generates a parallel scanning lines by harmonizing with flight speed.
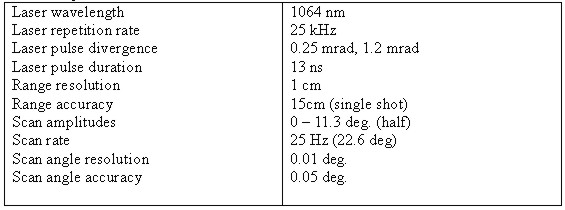
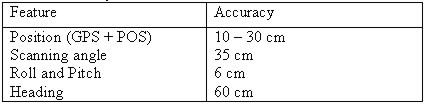
The coordinates and elevation of laser beam reflecting points are determined by GPS position, POS orientation, scanning angles and ranges of laser, so that we have to measure the relative position of each sensors before flight. Table 1 shows principal specifications of the ALTM 1025. Table 1. specification
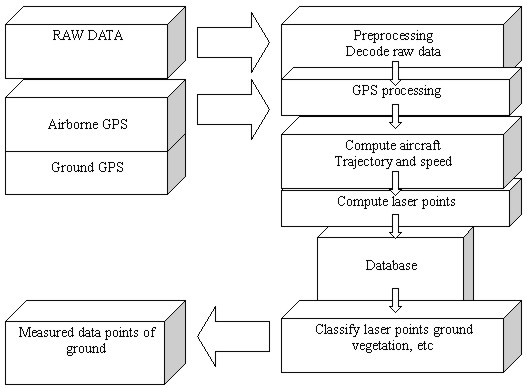
The ground post-processing subsystem comprises such devices as a data processing PC with 10 GBytes memories; data analyzing PC, data processing of the ground post-processing is shown in Fig.2.
Fig.2. Logical sequence of post-processing The ground post-processing subsystem has an excellent software that provides a DEM without trees, buildings and other constructions. The prescribed laser points software is based on J. Lindenburger (1993), which is to eliminate the data of man made structures and elevated points except ground surface within a specified limit. (2) Accuracy of data The measured laser point includes a complex error derived from each devices of airborne system. The errors that generated by each device of airborne system may accumulate to form a complex error for the measured point. (Angle data are converted into length in case of flight height 400m). Table 2 shows the accuracy of data. Table 2. Accuracy of data
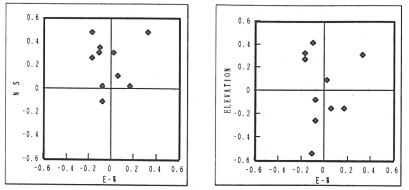
Fig.3 shows the relative errors between actual survey and airborne laser scanning. This result was obtained by targeting a ground control point, which is elevated about 1m from the ground.
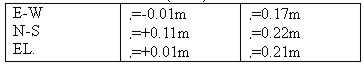
Fig.3 Relative errors of airborne laser survey (m) The distribution of error ranges from about +0.5m to -0.5m; E-W +0.33 to -0.17m, N-S +0.48 to -0.11m and elevation +0.32 to -0.54m; average -0.01m in E-W, 0.22m in N-S and 0.02m in elevation. Another survey data, statistic become as follows (Table3). Table 3. Statistic of error (n =21)
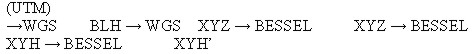
(3) Data processing Each data is converted into UTM coordinate system and then to Bessel and WGS84 by the ground post-processing subsystem.
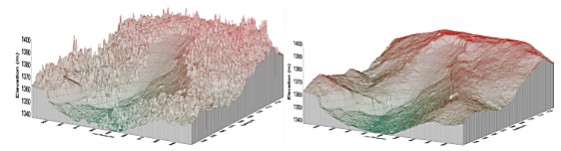
MICROSTATION software that was designed by Bentley Systems Inc. is used to convert the measured data into DEM. Fig.4 shows bird's-eye and side views of a topographic surface sample before and after processing. These DEM are created in 50m-grid spacing because the space of each shot is about 25cm and that of each scanning line is about 40cm. The DEM before smoothing has many spikes, whose height range 15-20cm in average, derived from the obstacles on the land surface and the little disorder of scanning. To remove these noises, we have processed the data by the matrix smoothing method; number of columns and raw of center in ten.
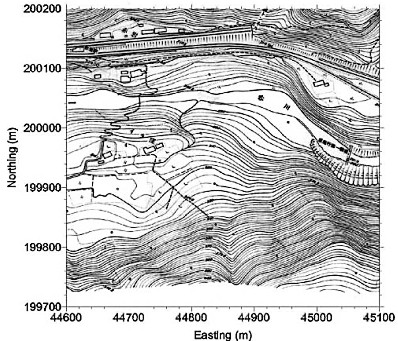
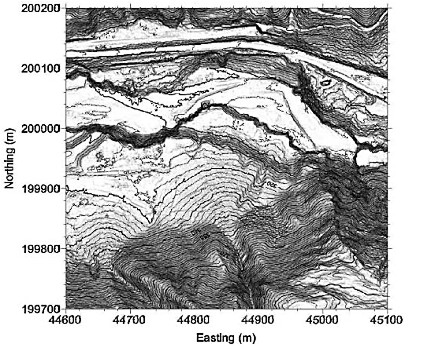
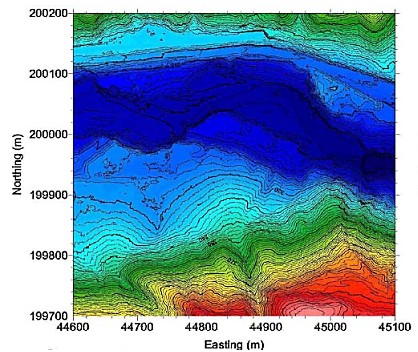
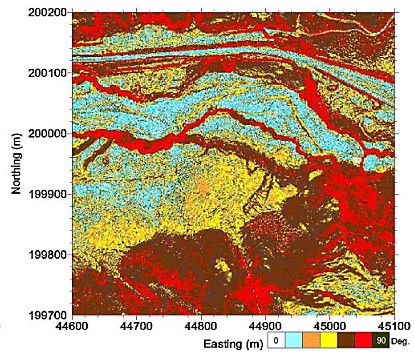
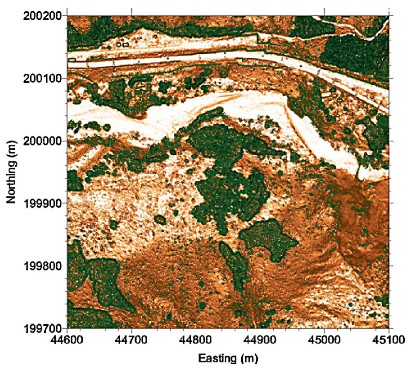
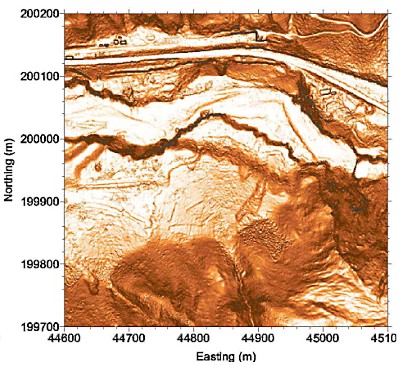
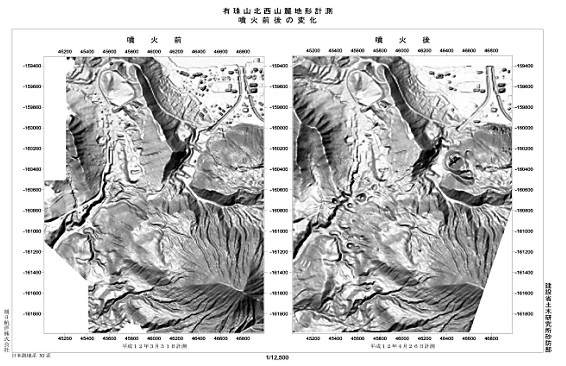
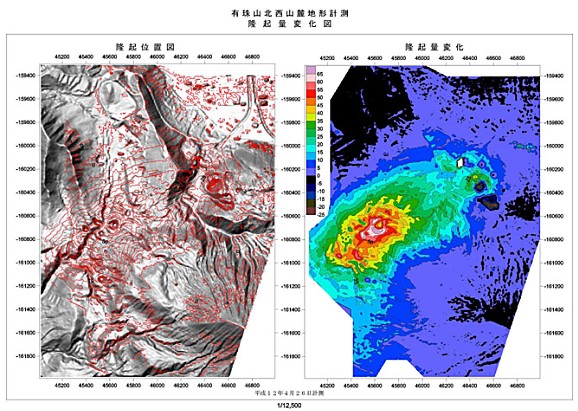
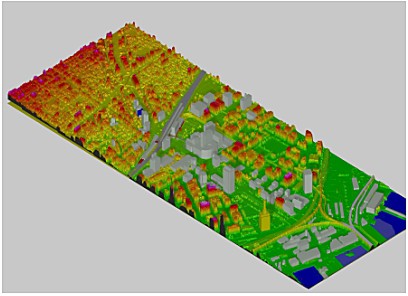
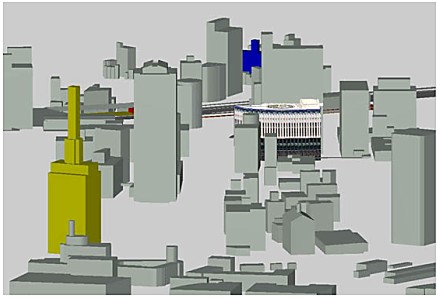
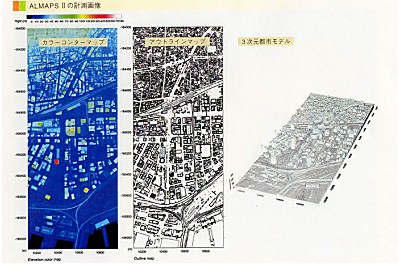
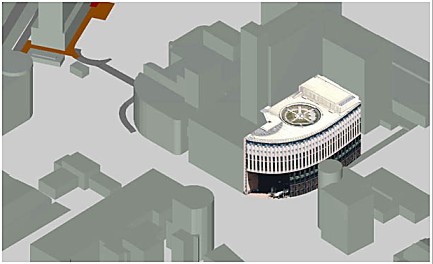
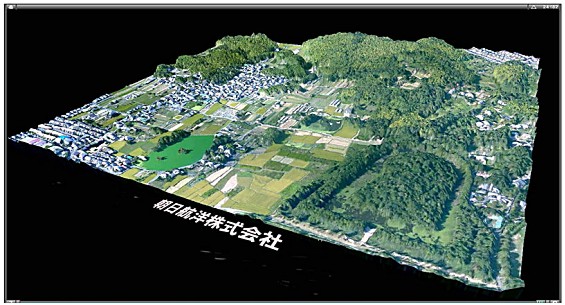
Fig. 4. Before and after tree and noise removing images 3. APPLICATION EXAMPLES3.1 Actual land surface analysisFig.5 - fig.10 is an analysis comparison figure of the same spot in scale of 1/2,500. The 2m-interval contour line indicates the feature of the river terrace and an alluvial fan, which is able to distinguish more clearly the difference when airborne laser results (fig.6) are compared with aerial photogrammetry results ( fig.5). Furthermore, fig .7 is a color elevation map, generated from the DEM, which can visualize the equivalency of the river bottom, and recognize the temporal change of riverbank of both side. Fig.8 is a slant incline division map, which indicates the slope degrees by color. The results can be referred as an interpretation of topographic. The traditional method of topographic interpretation is to identify the division such as in fig.8 by using the topographic maps prepared from aerial photogrammetry (fig.5). The indistinct area shall be surveyed by additional field survey, which will increase the total cost volume and time. Airborne laser measurement can eliminate those works by measuring the actual land surface automatically in high accuracy by using the last pulse mode. Fig.9 and fig.10 are the samples, which the results from first and last pulse data have been visualized by the preparation of the artificial shaded relief image. The characteristics of these images are the indicated features in shadows, which result from optical devices such as aerial photographs, are not able to indicate the objects inside the shadows of trees and buildings. This means that the results from airborne laser measurement have no connection with optical ray, which can also be surveyed in night time. 3.2 An astonishing land deformation by abrupt volcanismsMt. Usu reopened the eruption activity on March 31, 2000. The topography is changed by tectonic movement as a result of eruption activity, and a large quantity of volcanic ashes, which spouted out and accumulated at the crater outskirts. The second measurement was done in April 26th which was approximately 1 month after the eruption, which still the smoke rose from several places of the crater. As for the laser pulse, more than 15% of laser ray were not able to penetrate the smoke and clouds, which make extra days to capture the complete landform feature, by taking the chance of the change of wind direction. The two temporal results which indicated the topography change, expressed by shaded relief map (fig.11), is able to distinguish the particular movement area, which was the peripheral area of crater in the south. The results have indicated that the recent eruption area was not the largest deformed area, whereas the western portion changed greatly, shown in the contour map in fig.12. The upheaval change map (Right side of fig.12) indicates the quantity of height difference of the first and last measurements, where the maximum deformation was 65m in western part, and 25m in Mt.Kompira area. Accordingly, the quantity of topography change during March 31st to April 26th was 39,533,199m3. The final evaluation from this survey can be stated as follows: The magma reservoir rises in the peripheral of southern crater group, and this was evaluated as a possibility of existence of potential dome, which has not still spouted out with essence magma on the surface of the landform. 3.3 City modelingThe experiment of city modeling by using airborne laser measurement results have been started from July 2000. The random elevation points that were acquired under 1m interval expresses the feature of the urban area. Fig.12 indicates the possibility of visualization of the elevation and the shape with high accuracy by using the high density laser points within 50cm range. However, in the case of preparing 3d-urban database in vector data, the outline of each structure has to be modeled, by generating the surface from the random elevation points. The difficulties of generating surface from random elevation points such as in fig.14, the feature outline is still hardly difficult to be determined automatically, because the algorithm of software shall include a self-evaluation technique to identify the outline of the structure. Fig.15 indicates the color evaluation map, which is prepared for city consulting, mobile-phone construction, and city visualization. 3.4 CG and Virtual RealitiesThe keyword for 21st century must be Virtual Realities, which the visualization techniques for three dimension models have been developed rapidly during this decades. CG technologies exist as the fundamental, which achieves the growth of the visualizing market and merge with other technologies such as the WEB. The visualized spatial data of topographic and urban area was prepared from the last pulse 50cm interval random point data, which can be downloaded from the Internet by using Web3D technologies. The latest Web3D technologies have the function to compress 3D data to minimize the volume. Fig.16, is one of the example using XVL (Extended VRML) technology from Lattice technology Inc., which can compress the 3D data to approximately 1/50 comparing with the VRML 2.0. 4. SUMMARYThe article indicates that there is a large potential capability to apply airborne laser measurement technology to a new market. Virtual Reality is one possibility, because preparation of 3D database in high accuracy, and preparation of orthogonal images by using digital CCD color camera, mobilized with the ALTM 1225 system, is getting inexpensive. Thus, in the near future, the opportunity to use urban or topographic data in 3D shall be more popular, and we believe that airborne laser measurement technology shall be one of the largest solutions of this 3D world. Airborne laser measurement Product name: ALMAPS(Asahi Laser Mapping System)
Fig.5 Map by aerial photogrammetry
Fig.6 Map by airborne laser measurement
Fig.7 Color elevation map
Fig.8 Slant incline division map
Fig.9 Shaded relief image (first pulse)
Fig.10 Shaded relief image (last pulse)
Fig.11 Shaded relief map (temporal images)
Fig. 12 Contour map and Upheaval change map
Fig. 13 Bird's eye view image
Fig.14 City modeling
Fig.15 Color elevation map
Fig.16 Web3D technology REFERENCESKazunori Takada, Yukihide AKIYAMA: The Possibility of water surface slope measurement with airborne laser profiling method: ISPRS Commission V Symposium, Hakodate, Japan. Pp284-289, 1998. Kenji OMASA, Yukihide AKIYAMA, Yasuhiro ISHIGAMI, Kenji YOSHIMI: 3-D Remote Sensing of Woody Canopy Heights using a Scanning Helicopter-borne Lidar System with High Spatial Resolution: Journal of Remote Sensing Society of Japan. 20,4, pp.34-46, 2000. Kimiaki NAKANO, Koichi SHIMIZU, Takao YAMAKOSHI, Takeshi NAKAMURA, Yukihide AKIYAMA, Junichi TAKANUKI: Geographical features change measurement in Mt. USU eruption by Helicopter-borne Lidar System in 2000: Journal of Japan Society of Erosion Control Engineering: 54, Just contribution, 2001. Koukichi KIMURA, Teruyoshi FUJIWARA, Yukihide AKIYAMA: EATIMATION OF ACCURACY OF AIRBONE LASER PROFILING: Proceeding International Workshop on Mobile Mapping Technology April 21-23, Bangkok, Thailand, (ISPRS, FIG, JARS, JSPRS, ARIDA), 1999. Reid, B, Sherzinger, B & Lithopulos, E., 1996. The Position and Orientation System (POS) for Airborne Survey Applications. Second int. Airborne Remote sensing Conf. And Exhibit. San Francisco, pp 24-27 Lindenburger, J., 1993. Laser-Profilmessungen zur Topographischen Gelandeaufnahme. Doctor Thesis, Muenchen Yukihide AKIYAMA: Application of Airborne Laser Survey System for forest conservation and erosion control in mountain region: Journal of the Society of Photogrammetry and Remote Sensing: 39,2,pp.25-28, 2000 CONTACTTakayuki Okubo 30 April 2001 This page is maintained by the FIG Office. Last revised on 15-03-16. |