Keywords: Optical, Microwave, Hyperspectral, Advanced
applications, Analysis
SUMMARY
The aim of this paper is to describe some advanced applications of
optical, microwave and hyperspectral remote sensing (RS) in Mongolia.
For this purpose, several case studies conducted for different
applications are highlighted. The first case study describes the
application of optical Quickbird data for urban land cover
classification. The second case study describes the applications of
microwave RS and it consists of three different studies. The first study
highlights the polarimetric calibration of ALOS PALSAR conducted in a
test site near Ulaanbaatar city, while the second study describes the
urban land cover mapping using optical and synthetic aperture radar
(SAR) data sets. The third study reviews the research on applications of
ground penetrating radar conducted in a water source area of Ulaanbaatar
city. The third case study highlights the research on applications of
hyperspectral RS for urban land cover discrimination. For the final
analyses, multisource satellite images with different spatial
resolutions, topographic and thematic maps of varying scales as well as
some ground truth data sets are used.
1. INTRODUCTION
At present, because of the rapid development of a human society and
the related newly emerging issues, appropriate planning and management
are becoming the major tasks of governments in both developed and
developing countries. For any planning and management, the detailed and
real-time spatial information can play an important role. For example,
such information can be successfully used for many different disciplines
including social planning, land cover/use change detection, natural
resources assessment, urban planning, environmental management and many
others (Amarsaikhan and Sato 2003). In general, spatial information can
be collected from a number of sources such as a field survey, planning
maps, topographic maps, digital cartography, thematic maps, global
positioning system and RS. Of these, only RS can provide detailed
real-time information that can be used for the real-time spatial
analysis (Amarsaikhan et al. 2009b).
Over the past few years, RS platforms, techniques and technologies
have been evolutionized. System capabilities have greatly improved and
the costs for the primary RS data sets have been drastically decreased.
Meanwhile, much satellite information can be available free of charge
from different sources on the Internet. Now the highest spatial
resolution images can be acquired with centimeters-accuracy, whereas the
ordinary high-resolution images can be acquired with a few meters
accuracy. This means that it is possible to extract different thematic
information of varying scales from RS images having different spatial
and spectral resolutions (Amarsaikhan et al. 2009a). Moreover, it is
possible to integrate the extracted from RS information with other
historical data sets stored in a geographical information system (GIS)
and conduct sophisticated analyses (Amarsaikhan et al. 2011).
Traditionally, multispectral RS images have been widely used for
different thematic applications. Since the end of the last century, SAR
and hyperspectral data sets have been increasingly available for the RS
specialists. It has been found that the images acquired at different
portions of electro-magnetic spectrum provide unique information when
they are integrated. For example, optical data contains information on
the reflective and emissive characteristics of the Earth surface
features, while the microwave data contains information on the surface
roughness, texture and dielectric properties of natural and man-made
objects (Amarsaikhan et al. 2007). Unlike the data sets from these
sources, hyperspectral images provide very detailed information about
the spectral behaviour of different features.
Mongolia has an extensive area (about 1.565.000sq.km) in comparison
with its sparsely populated 2.8 million inhabitants. In addition, the
country is very rapidly developing and there are tremendous needs for
the updated spatial information. Therefore, RS can play a vital role for
a thematic mapping as well as planning and management. The aim of this
paper is to demonstrate some studies conducted in different test areas
of Mongolia based on optical, microwave and hyperspectral RS. For this
purpose, several case studies conducted for different applications have
been described. For the final analyses, multisource satellite images
with different spatial resolutions as well as topographic and thematic
maps of varying scales have been used and different RS and GIS
techniques were applied.
2. CASE STUDIES
2.1. Case study-1: Application of Optical RS for Urban Land Cover
Classification
The aim of this study is to classify urban land cover types using
Quickbird image. For the identification of urban land-cover types a
knowledge-based classification technique based on a rule-based approach
has been constructed. The constructed method uses an initial image
segmentation procedure based on a Mahalanobis distance classifier as
well as the constraints on spectral and spatial thresholds. The result
of the knowledge-based method was compared with a result of a
statistical maximum likelihood classification (MLC) and it demonstrated
higher accuracy.
Test site and data sources
As a test site, Baga toiruu area situated in central part of
Ulaanbaatar, the capital city of Mongolia has been selected. The Baga
toiruu is the city business district of Ulaanbaatar where different
government, educational, cultural and commercial organizations are
located. The location of the Baga toiruu area represented in a
panchromatic Quickbird image of 2006 is shown in figure 1a.
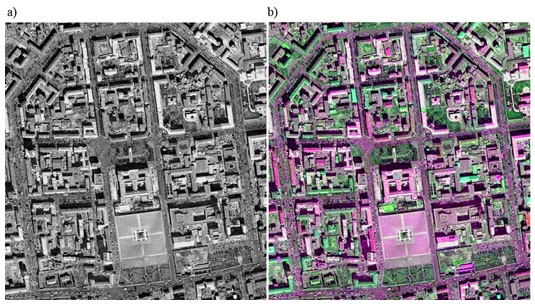
Figure 1. The test area represented in a panchromatic Quickbird
image of 2006 (a),
the Brovey transformed image of the test area (b).
As the RS data sources, multispectral and panchromatic Quickbird
images of 2006 have been used. The Quickbird data has four multispectral
bands (B1: 0.45–0.52μm, B2: 0.52–0.60μm, B3: 0.63–0.69μm, B4:
0.76–0.90μm) and one panchromatic band (Pan: 0.45-0.9μm). The spatial
resolution is 0.63m for the panchromatic image, while it is 2.44m for
the multispectral bands. The high spatial resolution of the panchromatic
image can distinguish most small elements at an object level which
multispectral bands cannot fully resolve. Therefore, a combination of
panchromatic and multispectral bands gives a real colour view of a
scene. In the current study, in addition to the Quickbird images, a
topographic map of 2000, scale 1:5000 and a GIS layer created on the
basis of the topographic map, were available.
Knowledge-based classification
Over the past years, knowledge-based techniques have been widely used
for the classification of RS images. The knowledge in image
classification can be represented in different forms depending on the
type of knowledge and necessity of its usage (Amarsaikhan and Douglas
2004). The most commonly used techniques for knowledge representation
are a rule-based approach and neural network classification (Amarsaikhan
et al. 2007). In the present study, for discrimination of the urban
land-cover types a rule-based approach has been applied.
As we had data sets with different spatial and spectral resolutions,
they should be merged for conducting further analyses. In this study, to
merge the images, Brovey transform and principal component analysis
(PCA) (Gonzalez et al. 2004) have been applied and the results were
compared. For the Brovey transform, the bands of 2,3 and 4 were
considered as the multispectral bands, while the panchromatic Quickbird
image was considered as the higher spatial resolution band. The PCA has
been performed using the available panchromatic and multispectral bands.
As it was seen from the PCA, the first three PCs contained almost 98.6%
of the total variance. The inspection of the last PC indicated that it
contained noise from the total dataset. Therefore, it was excluded from
the analysis.
In order to obtain a reliable image that can illustrate the spectral
and spatial variations in the selected classes of objects, different
band combinations have been compared. Although, the image created by the
Brovey transform contained some shadows that were present on the
panchromatic image, it still illustrated good result in terms of
separation of the available land use classes and individual objects. The
image created by the PCA method contained less shadows, however, it was
very difficult to analyze the final image, because it contained too much
color variation of objects belonging to the same class. Therefore, for
further analysis the image created by the Brovey transform has been
used. As seen from the Brovey transformed image shown in figure 1b, all
details are clearly seen.
To extract the urban land cover information, a rule-based approach
which consists of a set of rules, that contains the initial image
segmentation procedure based on a Mahalanobis distance classifier
(Mather 1999) and the constraints on spectral parameters and spatial
thresholds, has been constructed. In the Mahalanobis distance
estimation, for the initial separation of the classes, only pixels
falling within 1.0-1.5 standard deviation (SD) and the Brovey
transformed features were used. The pixels falling outside of 1.0-1.5 SD
were temporarily identified as unknown classes and further classified
using the rules in which different spectral and spatial thresholds were
used. The spectral thresholds were determined based on the knowledge
about spectral characteristics of the selected classes, whereas the
spatial thresholds were determined based on polygon boundaries of the
created GIS layer. The image classified by this method is shown in
figure 2b. As seen from the classified image, the rule-based approach
could very well separate all individual objects. For the accuracy
assessment of the classification result, the overall performance has
been used. As ground truth information, for each class several regions
containing the total of 3268 purest pixels have been selected. The
confusion matrix indicated an overall accuracy of 98.26%.
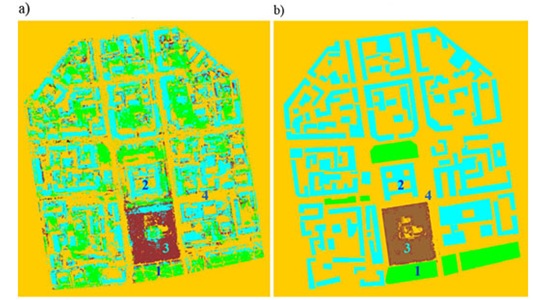
Figure 2. a) The result of the MLC, b) The result of the
rule-based method.
(1-Vegetation, 2-Builtup area, 3-Central square, 4-Open area).
To compare the performance of the developed algorithm and a standard
method, the same set of features and training signatures used for the
rule-based classification, were classified using the statistical MLC.
The image classified by the MLC method is shown in figure 2a. The
confusion matrix indicated an overall accuracy of 86.34%. As seen from
the classification results shown in figure 2, the result of the
rule-based method looks much better than that of the standard method and
the extracted objects are very accurately delineated forming the classes
of objects.
2.2. Case study-2: Applications of Microwave RS
Case study-2a: Polarimetric Calibration of ALOS PALSAR Data
The aim of this study is to carry out polarimetric calibration of
ALOS PALSAR data. PALSAR operates in L-band (1.27GHz) and is capable to
observe the ground surface conditions accurately compared to other SAR
systems operating at higher frequencies, namely C-band or X-band. The
data acquisition for polarimetric calibration was conducted on 25 May
2006. Corner reflectors were set in a flat area inside the Chingis Khan
International airport. The ground surface was covered by grass, having
about 30cm height. In the study, 4 corner reflectors were set and they
were aligned along a straight line parallel to the run way, and each
corner reflector was separated by 100m from each other (Sato et al.
2010).
Figure 3 shows the polarimetric SAR images (the single bounce (a),
the double bounce (b) and the volume scattering (c) components)
represented using a Pauli decomposition. We can find the locations of 3
dihedral corner reflectors in Figure 3a and they represent the single
bounce component of the polarimetric SAR image. The dihedral corner
reflector can be seen in Figure 3b and it represents the double-bounce
component of the polarimetric SAR image. As could be seen that the
background scattering is stronger than the expected one and it is
probably due to the shallow off-nadir angle which was used during the
data acquisition.
As we could determine the locations of the corner reflectors from the
polarimetric SAR images, it is possible to pick up the polarimetric
scattering coefficients from the SAR images in order to confirm the
polarimetric characteristics of the SAR images. After calculating,
scattering matrices for the trihedral and dihedral corner reflectors, it
was possible to confirm that for all corner reflectors, the measured
scattering matrices well corresponded to the theoretical ones. Figure 4
shows the polarimetric PALSAR image of Ulaanbaatar area acquired in May
2006. As seen from the image, the city and bare ground are dominated by
the HH and VV components, while the mountain area is dominated by HV
component (Sato et al. 2010).
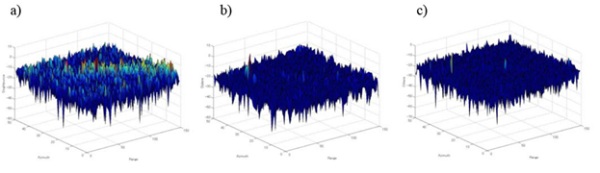
Figure 3. The polarimetric SAR images represented using a Pauli
decomposition.
(a) the single bounce, (b) the double bounce and (c) the volume
scattering components.
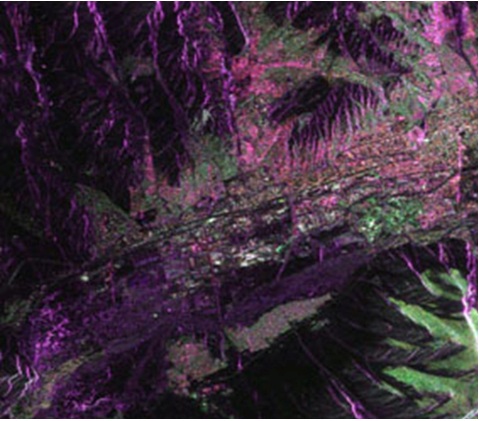
Figure 4. Polarimetric PALSAR image of Ulaanbaatar area.
Case study-2b: Urban Land Cover Mapping using Optical and SAR Data
sets
In recent years, very high spatial resolution optical and SAR data
sets have become increasingly available from space platforms and this
makes it possible to extract very detailed land cover information from
such data. Over the past decade, the integrated features of the optical
and microwave data sets have been efficiently used for an improved land
cover mapping. Many authors have proposed different techniques to
separate the existing land cover classes from the combined optical and
SAR images and they all judged that the results were better. The main
aim of this study is to evaluate the features from the combined optical
and microwave data sets in terms of separation of urban land cover
types. For this purpose, a refined Bayasian classification algorithm has
been constructed. For the actual analysis, very high resolution TerraSAR
and Quickbird images of Ulaanbaatar area, Mongolia were used.
Co-registration of the images and speckle suppression of the
TerraSAR
In order to perform accurate data fusion, both high geometric accuracy
and good geometric correlation between the images are needed. As a first
step, the Quickbird image was georeferenced to a Gauss-Kruger map
projection using 9 ground control points (GCPs) defined from a field
survey. The GCPs have been selected on clearly delineated crossings of
roads, streets and city building corners. For the transformation, a
second-order transformation and nearest-neighbour resampling approach
were applied and the related root mean square error (RMSE) was 1.06
pixel. Then, the TerraSAR image was geometrically corrected and its
coordinates were transformed to the coordinates of the georeferenced
Quickbird image. In order to correct the SAR image, 15 more regularly
distributed GCPs were selected from different parts of the image. For
the actual transformation, a second-order transformation was used. As a
resampling technique, the nearest-neighbour resampling approach was
applied and the related RMSE was 1.48 pixel. As both optical and
microwave images had a very high spatial resolution, the errors of less
than 1.5m were considered as acceptable for further studies (Amarsaikhan
et al. 2010).
As microwave images have a granular appearance due to the speckle
formed as a result of the coherent radiation used for radar systems; the
reduction of the speckle is a very important step in further analysis.
The analysis of the radar images must be based on the techniques that
remove the speckle effects while considering the intrinsic texture of
the image frame (Serkan et al. 2008). In this study, five different
speckle suppression techniques such as local region, median, lee-sigma,
frost and gammamap filters (Amarsaikhan and Saandar 2011) of 5x5 and 7x7
sizes were compared in terms of delineation of urban features and
texture information. After visual inspection of each image, it was found
that the 5x5 gammamap filter created the best image in terms of
delineation of different features as well as preserving content of
texture information. In the output image, speckle noise was reduced with
very low degradation of the textural information.
Derivation of features and standard Bayesian classification
Initially, in order to increase the spatial homogeneity of the data, to
the TerraSAR image, a 3x3 average filtering was applied. Then, to derive
texture features from the multisource images, contrast, entropy and
dissimilarity measures (using a 15x15 window size) have been applied and
the results were compared. The bases for these measures are the
co-occurrence measures that use a grey-tone spatial dependence matrix to
calculate texture values, and the matrix shows the number of occurrences
of the relationship between a pixel and its specified neighbor (ENVI
1999). The contrast measure indicates how most elements do not lie on
the main diagonal, whereas, the entropy measures the randomness and it
will have its maximum when all elements of the co-occurrence matrix are
the same. The dissimilarity measure indicates how different the elements
of the co-occurrence matrix are from each other (Karathanassi et al.
2007). By applying these measures, initially 15 features have been
derived, but after thorough checking of each individual feature only 4
features, including the results of the entropy measure applied to HH
polarization image of TerreaSAR and infrared band of Quickbird, and the
results of the dissimilarity measure applied to VV polarization image of
TerreaSAR and infrared band of Quickbird, were selected.
To define the sites for the training signature selection from the
multisensor images, two to four areas of interest (AOI) representing the
available six classes (built-up area, ger area, open area, road, central
squire and ice) have been selected through analysis of the fused images.
As the data sources included both optical and SAR features, the fused
images were very useful for the determination of the homogeneous AOI as
well as for the initial intelligent guess of the training sites. The
separability of the training signatures was firstly checked in feature
space and then evaluated using Jeffries–Matusita distance. After the
investigation, the samples that demonstrated the greatest separability
were chosen to form the final signatures. The final signatures included
about 3415–10534 pixels. For the classification, the following feature
combinations were used:
- The original spectral bands of the Quickbird data.
- The HH and VV polarization components of TerreaSAR and original
spectral bands of the Quickbird data.
- Multiple bands including the original TerreaSAR and Quickbird
images as well as four other derivative bands obtained from texture
measures.
- The PC1, PC2, PC3 and PC4 of the PCA (PCA was performed using 9
bands including the original TerreaSAR and Quickbird images as well
as four texture features and, the first four PCs included 99.9% of
the overall variance).
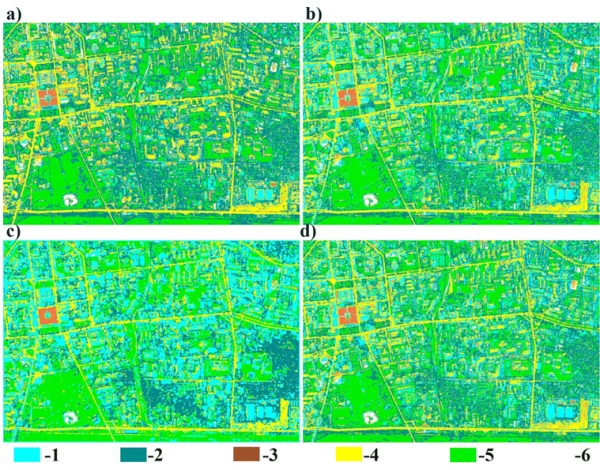
Figure 5. Comparison of the supervised classification results for
the selected classes (1-built-up area; 2-ger area;
3-central squire; 4-roads; 5-open area; 6-snow-ice). Classified images
(a) using Quickbird bands,
(b) using Quickbird and TerraSAR bands, (c) using multiple bands, (d )
using the PCs.
For the actual classification, standard Bayesian MLC has been used
assuming that the training samples have the Gaussian distribution
(Richards and Jia 1999). To increase the reliability of the
classification, to the initially classified images, a fuzzy convolution
with a 5x5 size window was applied. The fuzzy convolution creates a
thematic layer by calculating the total weighted inverse distance of all
the classes in a determined window of pixels and assigning the centre
pixel the class with the largest total inverse distance summed over the
entire set of fuzzy classification layers, i.e. classes with a very
small distance value will remain unchanged while the classes with higher
distance values might change to a neighboring value if there are a
sufficient number of neighboring pixels with class values and small
corresponding distance values (ERDAS 1999). The visual inspection of the
fuzzy convolved images indicated that there are some improvements on the
borders of the neighboring classes that significantly influence the
separation of the decision boundaries in multidimensional feature space.
The final classified images are shown in figure 5(a–d). As seen from
figure 5(a–d), the classification result of the Quickbird image gives
the worst result, because there are high overlaps among classes:
built-up area, ger area and open area. However, these overlaps decrease
on other images for the classification of which SAR and optical bands as
well as other derivative features have been used. As could be seen from
the overall classification results, although the combined use of optical
and microwave data sets produced a better result than the single source
image, it is still very difficult to obtain a reliable land cover map by
the use of the standard technique, specifically on decision boundaries
of the statistically overlapping classes (Amarsaikhan et al. 2010).
For the accuracy assessment of the classification results, the
overall performance has been used. As ground truth information,
different AOIs containing 56,864 purest pixels have been selected. AOIs
were selected on a principle that more pixels to be selected for the
evaluation of the larger classes such as built-up area and open area
than the smaller classes such as central squire and snow-ice. The
overall classification accuracies for the selected classes were 69.24%,
75.37%, 81.96% and 76.92% for the original spectral bands of Quickbird,
TerreaSAR and Quickbird data, multiple bands, and PC1, PC2, PC3 and PC4,
respectively.
The refined Bayesian classification
Unlike the traditional Bayesian classification, the constructed
classification algorithm uses spatial thresholds defined from the local
knowledge. The local knowledge was defined on the basis of the spectral
variations of the land surface features on the fused images as well as
the texture information delineated on the dissimilarity images. It is
clear that a spectral classifier will be ineffective if applied to the
statistically overlapping classes such as built-up area and ger area
because they have very similar spectral characteristics. For such
spectrally mixed classes, classification accuracies should be improved
if the spatial properties of the classes of objects could be
incorporated into the classification criteria. The idea of the spatial
threshold is that it uses a polygon boundary to separate the overlapping
classes and only the pixels falling within the threshold boundary are
used for the classification. In that case, the likelihood of the pixels
to be correctly classified will significantly increase, because the
pixels belonging to the class that overlaps with the class to be
classified using the threshold boundary are temporarily excluded from
the decision making process. In such a way, the image can be classified
several times using different threshold boundaries and the results can
be merged (Amarsaikhan and Sato 2004).
The result of the classification using the refined
method is shown in figure 6. For the accuracy assessment of the
classification result, the overall performance has been used, taking the
same number of sample points as in the previous classifications. The
confusion matrix produced for the refined classification method showed
overall accuracy of 90.96%. As could be seen from figure 6, the result
of the classification using the refined Bayesian classification is much
better than result of the standard method.
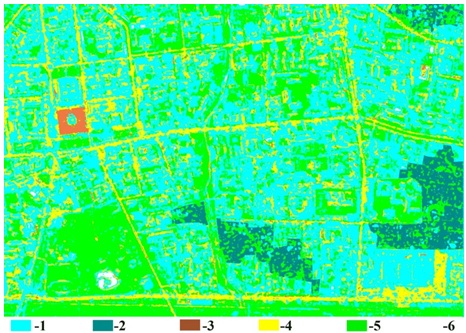
Figure 6. Classification result
obtained by the refined method.
Case study-2c: Application of Ground Penetrating Radar
Ground penetrating radar (GPR) is known as a very powerful
geophysical exploration technique for subsurface sensing. The aim of
this study is to assess the potential of a GPR for detecting and
monitoring groundwater movement and estimate the hydraulic properties of
an aquifer. For this purpose, GPR surveys have been conducted at a water
source area of Ulannbaatar city.
In general, Ulaanbaatar city solely depends on the groundwater
withdrawn from an alluvial aquifer, distributed in the Tuul River basin,
which is mainly located in the southern part of the city. The water is
supplied from water production wells. At present, with the increase in
population and rapid economic development, Ulaanbaatar city is facing
water shortages. Therefore, assessing the groundwater from a well and
its production capacity has become very important for all citizens of
the capital city. If the groundwater level change around the production
well can be observed by GPR, it will provide much useful information
about the aquifers. The groundwater level in the Ulaanbaatar city area
is between 2-10 m, and the GPR technique is suitable for detecting this
relatively shallow aquifer (Sato et al. 2010).
Within the framework of the present study, field experiments were
conducted in Ulaanbaatar in October 2001 and in April 2002. The GPR
survey lines were located around a pumping well. By varying the water
production, GPR was used for detecting the change of groundwater
conditions around the well. An appropriate approach for estimating
hydraulic properties involves the development of a detailed model of the
aquifer system. This study focuses on the practical use of GPR for
groundwater monitoring, tries to quantify the groundwater level change,
and estimates the hydraulic properties by assuming a model of the
aquifer system.
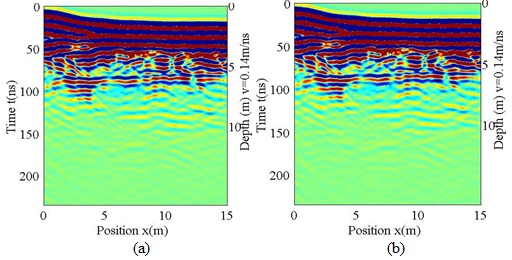
Figure 7 shows the GPR profiles measured at a low water condition
as well as a high water condition, which were controlled by a pumping
operation. As seen from the figure 7, one can very clearly observe the
change of the
ground water condition.
2.3. Case study-3: Application of Hyperspectral RS
In recent years, processing of hyperspectral data has attracted many
researchers dealing with RS image processing. Unlike the traditional
multispectral data taken in the optical range of electro-magnetic
spectrum, the hyperspectral data deals with a great number of bands and
many attempts are being made to reduce the dimensionality of the data
and extract reliable information needed for various decision-making
processes. Especially, for classification applications, hyperspectral
data sets provide enormous potential for an improved discrimination
between the land cover types or features having very similar spectral
characteristics (Amarsaikhan and Ganzorig 1999, Demir and Erturk 2008).
The aim of this study is to classify urban land cover types using
Hyperion hyperspectral data sets.
Hyperion is a hyperspectral sensor launched by NASA in November 2000
and it marked the establishment of spaceborne hyperspectral mapping
capabilities. It covers 0.4μm to 2.5μm spectral range with 242 spectral
bands at approximately 10nm spectral resolution and the data has 30m
spatial resolution. The instrument captures 256 spectra over a
7.5km-wide swath perpendicular to the satellite motion (Kruse 2002). In
the present study, a Hyperion image of Ulaanbaatar area taken on 18
August 2002 has been used. For the land cover classification, a spectral
angle mapper method was used. The spectral angle mapper is one of the
most widely used hyperspectral classification techniques and it uses an
n-dimensional angle to match pixels to reference spectra. The method
determines the spectral similarity between two spectra by calculating
the angle between the spectra, treating them as vectors in a space with
dimensionality equal to the number of bands.
To evaluate the performance of the hyperspectral data for a land
cover discrimination, the result of the Hyperion image classification
was compared with a result of Landsat ETM image of August 2002. Figure
8(a-d) shows the original Hyperion and Landsat ETM images and their
classified results. As seen from the figure 8, although both images
performed well, still hyperspectral image performed better in terms of
discrimination between fuzzy classes: green vegetation (grass) and
decidous forest as well as between decidous forest and coniferous
forest. The advantage of a hyperspectral image is that looking at a
spectral curve, one can select the most separable bands and use them for
the improved classification. The comparison of the spectral curves of
the selected classes (ie, urban area, soil, green vegetation, decidous
forest, coniferous forest and water) is shown in figure 9. As seen from
the figure, the hyperspectral image has much more advantage than the
ordinary multispectral image.
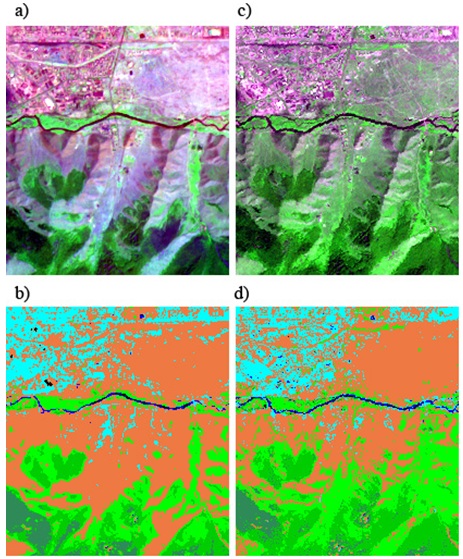
Figure 8. The original Hyperion (a) and Landsat ETM (c) images.
The classified images of Hyperion (b) and Landsat ETM (d).
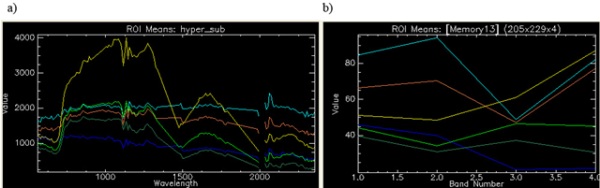
Figure 9. Spectral curves of the selected classes in Hyperion (a)
and Landsat ETM (b) images.
Moreover, it is possible to check the reliability of the selected
features on a feature space and validate them for further classification
analysis. Figure 10 shows the highly correlated and less correlated
features. As seen from the figure 10, neiboring bands have very high
correlation, while the bands selected from different ranges have less
correlation.
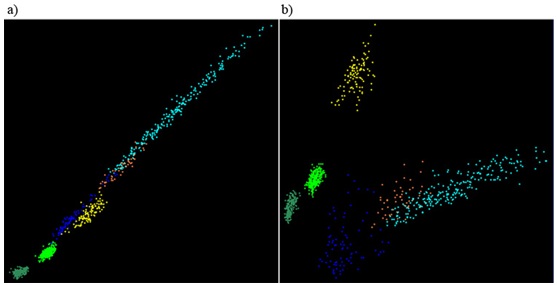
Figure 10. The highly correlated (a) and less correlated (b)
bands.
3. CONCLUSIONS
The aim of this research was to apply some advanced techniques based
on optical, microwave and hyperspectral RS for different thematic
studies in Mongolia. For this purpose, several case studies were
highlighted. The first case study described the combined use of
panchromatic and multispectral
Quickbird images of Ulaanbaatar city for urban land cover
classification. The second case study highlighted three different
applications of microwave RS. The first application described the
polarimetric calibration of ALOS PALSAR conducted in a test site near
Ulaanbaatar city and further backscatter analysis of polarimetric
characteristics. The second application highlighted an integrated use of
multispectral Quickbird and polarimetric TerraSAR images for an improved
urban land cover mapping. The third application reviewed the research on
the use of GPR technology for determination of a ground water level in a
water source area of Ulaanbaatar city. The third case study described
the applications of hyperspectral RS for an urban land cover mapping
where the classification result of a 242 band Hyperion image was
compared with the result of Landsat ETM image. Overall, the study
demonstrated that the multisource RS data sets could significantly
improve land cover analyses, and support planning and management.
REFERENCES
- Amarsaikhan, D. and Ganzorig, M., 1999, Different approaches in
feature extraction for hyperspectral image classification, Invited
paper published in Proceedings of the 20th Asian Conference on RS,
Hong Kong, pp.434-438.
- Amarsaikhan, D. and Sato, M., 2003, The role of high resolution
satellite images for urban area mapping in Mongolia, Full paper
published in the ‘Reviewed Papers’ part of Proceedings of the
Computers for Urban Planning and Urban Management (CUPUM)’03
International Conference, Sendai, Japan, pp.1-12.
- Amarsaikhan, D. and Douglas, T., 2004, Data fusion and
multisource data classification, International Journal of Remote
Sensing, No.17, Vol.25, pp.3529-3539.
- Amarsaikhan, D. and Sato, M., 2004, Validation of the Pi-SAR
data for land cover mapping, Journal of the Remote Sensing Society
of Japan, No.2, Vol.24, pp.133-139.
- Amarsaikhan, D., Ganzorig, M., Ache, P. and Blotevogel, H.,
2007, The integrated use of optical and InSAR data for urban land
cover mapping, International Journal of Remote Sensing, Vol.28,
No.6, pp.1161-1171.
- Amarsaikhan, D., Blotevogel, H.H., Ganzorig, M. and Moon, T.H,
2009a, Applications of remote sensing and geographic information
systems for urban land-cover changes studies in Mongolia,
Geocarto-International, A Multi-Disciplinary Journal of Remote
Sensing and GIS, Vol. 24, No. 4, August 2009, 257–271.
- Amarsaikhan, D., Ganzorig, M., Blotevogel, H.H., Nergui, B. and
Gantuya, R., 2009b, Integrated method to extract information from
high and very high resolution RS images for urban planning, Journal
of Geography and Regional Planning, Vol. 2(10), pp. 258-267.
- Amarsaikhan, D., Blotevogel, H.H., van Genderen, J.L., Ganzorig,
M., Gantuya, R. and Nergui, B., 2010, Fusing high resolution
TerraSAR and Quickbird images for urban land cover study in
Mongolia, International Journal of Image and Data Fusion, Vol.1,
No.1, pp.83-97.
- Amarsaikhan, D. and Saandar, M., 2011, Chapter - “Fusion of
Multisource Images for Update of Urban GIS” in “IMAGE FUSION” BOOK
published by InTECH Open Access Publisher, pp.1-26.
- Amarsaikhan, D., Chinbat, B. and Ganzorig, M., 2011,
Applications of RS and GIS for urban land use change study in
Ulaanbaatar city, Mongolia, Journal of Geography and Regional
Planning Vol. 4(8), pp. 471-481.
- Demir, B. and Erturk.S., 2008, Improved classification and
segmentation of hyperspectral images using spectral warping, IJRS,
Vol.29, 12, 3657-3663.
- ENVI, 1999, User’s Guide, Research Systems.
- ERDAS, 1999, Field guide, Fifth Edition, ERDAS, Inc. Atlanta,
Georgia.
- Gonzalez, A.M. Saleta, J.L. Catalan, R.G. Garcia, R., 2004,
Fusion of multispectral and panchromatic images using improved IHS
and PCA mergers based on wavelet decomposition. IEEE Transactions
Geoscience and Remote Sensing, 6, pp.1291- 1299.
- Karathanassi, V., Kolokousis, P. and Ioannidou, S., 2007, A
comparison study on fusion methods using evaluation indicators,
International Journal of Remote Sensing, 28, pp.2309 – 2341.
- Kruse, F.A., 2002, Comparison of AVIRIS and Hyperion for
hyperspectral mineral mapping, 11th JPL Airborne Geoscience
Workshop, 4-8 March 2002, Pasadena, California.
- Mather, P.M., 1999, Computer Processing of Remotely-Sensed
Images: An Introduction, Second Edition, (Wiley, John & Sons).
- Richards, J. A. and Jia, S., 1999, Remote Sensing Digital Image
Analysis—An Introduction, 3rd edn (Berlin: Springer-Verlag).
- Sato, M., Tseedulum, K. and Amarsaikhan, D., 2010, GPR and
Polarimetric SAR Observation of Environment of Mongolia, Full paper
published in Proceedings of the XVII International Symposium of
Kherlen Geological Expedition, Ulaanbaatar, Mongolia.
- Serkan, M., Musaoglu, N., Kirkici, H. and Ormeci, C., 2008, Edge
and fine detail preservation in SAR images through speckle reduction
with an adaptive mean filter, International Journal of Remote
Sensing, Volume 29, Issue 23, First published 2008, pp.6727 – 6738.
BIOGRAPHY OF ACADEMICIAN DAMDINSUREN AMARSAIKHAN
Academician Damdinsuren Amarsaikhan, Head of Geoinformatics
Laboratory, Institute of Informatics and RS, Mongolian Academy of
Sciences and Professor at National University of Mongolia was born in
1964 in Mongolia.
In 1997 he obtained a PhD Degree from the Mongolian Technical
University. His thesis entitled “Update of a GIS by RS data using a
knowledge-based approach” describes the part of his research on design
and implementation of a spatial decision support system, and its update
by RS data. In 2006, he defended a Degree of Doctor of Science at the
Mongolian Academy of Sciences. His thesis entitled “Scientific basis for
update of integrated GIS by multisource information” describes a
systematic approach to update an integrated GIS by the information from
different sources.
He was a visiting professor and researcher at the German Aerospace
Research Establishment-DLR (1997), University of Newcastle, UK (2001),
University of Dortmund (2005) and Geyongsang National University, Korea
(2005, 2006, 2007 and 2008). From August 2002 to August 2004, he was a
JSPS (Japan Society for the Promotion of Science) postdoctoral research
fellow with research status as professor at the Center for Northeast
Asian Studies, Tohoku University, Japan. In 2008-2009, he was a visiting
professor of Humboldt Foundation at the Dortmund University of
Technology, Germany.
His professional interests include design and implementation of GISs;
development of techniques for multisource data analysis; spatial data
management; urban planning and management using RS and GIS;
environmental monitoring and natural resources management using RS, GIS
and spatial statistics; land use/cover change study using geoinformatics
methods.
He is an author and co-author of about 150 international and national
papers published in the scientific journals and conference proceedings
and also the main author and editor-in-chief of the books ‘Principles of
Remote Sensing and Geographical Information Systems’ and ‘Principles of
Geographical Information Systems for Natural Resources Management’ the
books ever to be written in the Mongolian language on the subject of RS
and GIS.
Academician D.Amarsaikhan is the winner of “The Young Scientist”
Prize, awarded by Third World Academy of Sciences; The Advanced
Scientist of Mongolia-2001; the winner of Second Prize of “The
Outstanding Scientist of Mongolia-2005” Prize, the award of the Year of
Mongolian Academy of Sciences and Ministry of Science and Education of
Mongolia, the winner of “The Best ITC Alumni Paper Award” awarded from
the ISPRS TC7 Mid-Term Symposium of 2006, the winner of Special Prize of
“The Outstanding Scientist of Mongolia-2008” Prize, the winner of “The
Most Outstanding IT Researcher of Mongolia-2009” Prize.
CONTACT
Damdinsuren Amarsaikhan,
Head of Geoinformatics Laboratory
Institute of Informatics and RS, Mongolian Academy of Sciences,
av.Enkhtaivan-54B, Ulaanbaatar-51, Mongolia
Tel: 976-11-453660 Fax: 976-11-458090
E-mail: amarsaikhan64@gmail.com