Positioning in Active Deformation Zones -
Implications for NetworkRTK and GNSS Processing Engines
|
Paul DENYS and Chris PEARSON, New Zealand
|
1)
This peer reviewed paper will be presented at the FIG Workign Week in
Christchurch, New Zealand. The paper considers examples in New Zealand of non-linear
deformation that includes post-seismic relaxation and slow slip events.
SUMMARY
New Zealand’s actively deforming landscape results in both gradual
and imperceptible deformation to instantaneous block shifts. The
geophysical processes that cause the deformation include the tectonic
plate motion (slow, regular deformation), earthquake events
(instantaneous coseismic deformation), post-seismic relaxation (slow
regular deformation) and slow slip events (irregular deformation
occurring at timescales from days to years).
Network RTK (NetworkRTK) and GNSS processing engines are current day
positioning applications that need to be able to accommodate deformation
that may be slow or fast, regular or irregular, in order to maintain
accurate and reliable coordinates. Most commercial software can only
apply velocities that are assumed to be linear. Deformation effects
that are non-linear are not accounted for, which potentially leads to
inaccurate coordinates.
There are two aspects that need to be considered. The first is the
ability to model the reference station coordinates, e.g. NetworkRTK.
Secondly, the ability to model and transform non-reference station
coordinates to the local datum, e.g. the rover positions computed using
NetworkRTK and the positions derived from a GNSS processing engine. For
reference station coordinates, geodetic time series modeling can be used
to accurately model both linear and non-linear deformation. But it
becomes more challenging to model non-uniform deformation at
non-reference positions.
This paper considers examples in New Zealand of non-linear
deformation that includes post-seismic relaxation and slow slip events.
1. INTRODUCTION
Most current day surveying applications, including survey and GIS
software, utilize coordinate systems that are based on a datum that is
referenced to a specific epoch in time. At a high level, modern datums
may be able to accommodate global tectontic motion (e.g. semi-dynamic
datums), but most applications and software assume that the coordinates
are unchanging. This simple model works well in regions of the world
that are located in the central, stable, regions of the major tectonic
plates. The model fails in regions that are actively deforming, which
are typically located on the tectonic plate boundaries. Some examples
include California (USA), Indonesia, Mediterranean countries, Japan and
New Zealand.
Over the last two decades, GNSS has been used as a prolific tool to
measure crustal deformation at local, regional and global scales. High
precision static network solutions have typically been used for large
and small scale land deformation and RTK applications used to measure
centimetre level deformation. Where the measured velocities are linear,
the deformation is uniform and is reasonably easy to correct. However,
we are now observing irregular or non-linear deformation that has been
caused by earthquake events (e.g. coseismic and post-seismic relaxation)
and slow slip events (SSE). The deformation caused by coseismic offsets
can be relatively easily measured and modelled through a combination of
post-earthquake geodetic surveys, continuous GNSS (cGNSS) and
differential interferometric synthetic aperture radar (DInSAR).
Earthquake post-seismic deformation evolves over time and is most easily
observed using networks of cGNSS sites, although DInSAR technology is
also a useful tool. Similarly, SSE deformation requires measurement
techniques that regularly measure position such as cGNSS and DInSAR.
Deformation events affect the underlying geodetic infrastructure.
Most modern coordinate systems in use today time tag the coordinates to
a reference epoch that is before the current epoch. This necessitates
the computation of current positions in terms of the reference epoch,
which can be done using a coordinate transformation or by applying the
secular velocity. Following an earthquake event, neither of these
methods are possible since the actual site deformation needs to be
accounted for.
The effect of active deformation becomes even more complex when
applications, such as Real Time Kinematic Networks (NetworkRTK) and GNSS
processing engines, are being used. Both systems require reference
station coordinates in the current epoch, which requires the prediction
(or otherwise) of the current position.
The coordinates of traditional geodetic infrastructure, for example
network marks, need to be either updated or an appropriate deformation
model needs to account for the events. Coseismic deformation is straight
forward to implement (see e.g. Crook and Donnelly, 2013), once the
offsets have been observed and modelled. More problematic is deformation
that is non-linear or deformation that evolves over time. Post-seismic
deformation tends to be regular in nature but requires frequent repeat
measurements over an extended period of time that can require years in
order to adequately model the effect. SSE tend to be irregular and can
only be modeled adequately after an event has occurred.
2. ACTIVE DEFORMATION IN NEW ZEALAND
2.1 Tectonic Setting
New Zealand’s location in the South West Pacific has resulted in the
land mass straddling the Australian and Pacific tectonic plates. Crustal
deformation resulting from instantaneous events (e.g. earthquakes),
short term events (e.g. volcanoes, slow slip events) and long term
secular plate motion all affect the geodetic infrastructure. Arguably
the most stable region of the country is north of Auckland (Australian
plate), although in the recent past Auckland has a history of volcanic
activity that has a high probability of occurring again. South of
Auckland the interaction of the plates becomes highly visible in the
Taupo Volcanic Zone (TVZ), which exhibits high thermal activity and
back-arc spreading (Darby and Meertens, 1995). Further east is the
subduction zone associated with the Hikurangi Trough and caused by the
Pacific Plate subducting under the Australian Plate. This subduction
zone extends along the east coast of the North Island and finishes under
the northern South Island. The subduction zone gives rise to the vocanic
activity seen on the Central Plateau (central North Island).
In the South Island, the dominat feature is the Alpine Fault that
extends approximately 650km from Blenheim across the northern South
Island and along the western edge of the Southern Alps to Milford Sound.
The Marlborough Fault System, in the north of the South Island, has a
number of subparaellel faults that transfers the plate boundary
deformation from the Hikurangi Trough to the Alpine Fault. The
subduction of the Pacific plate discountinues, the Alpine Fault starts
and continues to Puysequr subduction zone to the south-west of the South
Island (Pearson et al., 2000). The motion of the central segment of the
Alpine Fault is strike slip with a component of compression that gives
rise to the uplift of the Southern Alps. Further south under Fiordland,
the Australian plate is subducted under the Pacific plate.
2.2 Geodetic Infrastructure
The implication of New Zealand straddling the Australian-Pacific
plate boundary is that the country is actively deforming. This results
in changes in the relative position of the crust, which distorts the
geodetic infrastructure and in turn results in a degradation of the
accuracy of survey marks. Following the acceptance of the theory of
plate tectonic in the 1960s, the effect of land deformation has been
well known although little was done about it. Once GNSS had been
demonstrated to be a viable and cost effective positioning tool,
standard static GNSS baseline networks soon measured land deformation of
up to five metres over the last century (Blick et al., 2009). This
resulted in a new geodetic datum, the New Zealand Geodetic Datum 2000
(NZGD2000) (Grant et al., 1999).
Users of position data (e.g. mapping agencies, GIS, utility
companies, engineering, topographical and cadastral surveys), prefer
non-changing coordinate data that is typically referred to a static
geodetic datum. This is not practical in New Zealand due to the active
deformation and depicted in Figure 1. To account for the national
deformation, GNSS data (both campaign and cGNSS has been used to compute
the national velocity field. The first model was based on campaign GNSS
data observed between 1992 and 1998 (Beavan and Haines, 2001). Except
for the eastern side of the North Island, the magnitude of the velocity
is reasonably constant at 40 mm/yr.
Active plate boundaries result in frequent events such as earthquakes
and slow slip events, which in turn results in non-linear velocities. A
secular or constant velocity field only (Figure 1) is insufficient to
define point positions accurately and this resulted in the development
of a National Deformation Model (NDM) that enables the inclusion of
localized deformation models to account for earthquake related activity
(e.g. Jordan et al., 2007).
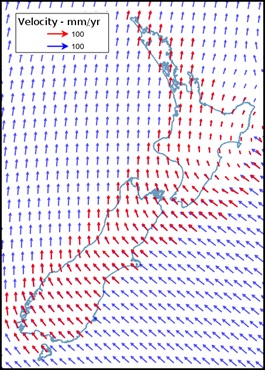
Figure 1: Vietnam Decentralised
Land Administration System Figure 1: The (secular) velocity field of the
National Deformation Model (NDM). Original model (red arrows) based on
GNSS campaign data from 1992-1998 and the current model (blue arrows)
based on campaign GNSS and cGNSS up until 2011.
Since 2003, there have been twelve major earthquake events with MW >
6. Many of these have results in ground surface movement, which if not
accounted for, will result in a degradation of the geodetic network.
Many of the events occur in Fiordland (south-west of the South Island)
and as this region is largely rural (National Park), it does have a
great impact. However, other events, such as the Darfield and
Christchurch events (2010-2011) had a huge impact (Kaiser et al., 2012).
Most of the Central Business District has been demolished and is in the
process of being re-built. To support the rebuild including roading,
underground and cadastral infrastructures, the survey and geodetic
network (including levelling) has had to be re-established (sometimes
several times). This required the development of a localized deformation
model for the Canterbury (including Christchurch) region (Winefield et
al. (2010), Crook and Donnelly (2013)).
3. NETWORK RTK AND GNSS PROCESSING ENGINES
While earthquakes such as the Christchurch events (2010-11) are
catastrophic, from a geodetic point of view they are reasonably straight
forward to deal with. The earthquake occurs, the coseismic offset can be
measured using a combination of techniques, for example GNSS positions,
DInSAR; the regional deformation pattern modelled and, in the case of
New Zealand, incorporated into a NDM (see e.g. Crook and Donnelly
(2013)).
More difficult to deal with is any post-seismic deformation, if the
event is sufficiently large or SSE, which are of a transient nature. The
accurate measurement of post-seismic relaxation may require several
years of positioning data. Depending upon the nature of the SSE
process, these events can occur periodically but not necessarily at
regular intervals
Today, many countries are establishing and using NetworkRTK
infrastructure that streams the carrier phase data from multiple
reference stations for processing. Compared to single base RTK,
one advantage of NetworkRTK is that the distance dependent errors are
modelled on a regional basis (e.g. atmospheric, orbit), which in turn
improves the accuracy and reliability of NetworkRTK over extended
distances. Two issues that affect the performance of NetworkRTK is
the accuracy of the reference station coordinates and ability to
transform a user’s position to the local datum.
Similar issues arise for GNSS processing engines. These engines
are often developed for global applications and work well when the
velocity field is well established or a standard global geological plate
motion model can be used e.g. NUVEL1A (DeMets et al., 1990, DeMets
et al., 1994), MORVEL (DeMets et al., 2010, Argus et al., 2011). Example
processing engines are shown in Table 1.
Table 1: Selected GNSS Processing Engines
The engines are generally simple to use requiring an email address
for the processing results, GPS/GNSS data files (RINEX, some
accept propriety data formats and multiple data files), antenna type and
height. Advantages of GNSS processing engines include automated
processing and data only needs to be collected using a single receiver.
3.1 NetworkRTK Station Coordinates
To maintain accuracy, the positions of the reference station network
need to be current epoch coordinates in terms of the current reference
frame (e.g. ITRF2008). Where all the site velocities are linear,
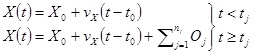
then the model is simply:
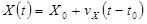 (1)
(1)
where is the position (coordinate) (metres) at time t, is the
reference position (metres) at time , is the site velocity
(metres/year), is the time (years) and is the reference time (years).
When a site is affected by deformation this simple model is inadequate
and will, over time, result in inaccurate positions and the degradation
of the performance of the NetworkRTK.
3.2 Coordinate Transformation
Provided the site velocities are uniform over the region covered by
the NetworkRTK, the coordinates may be transformed using standard
transformations e.g. Helmert Similarity or Horizontal Conformal
transformations. Depending upon the user’s application, these
transformations could be simplified to a block shift (e.g. Haasdyk and
Janssen, 2012).
Standard transformation methods do not work satisfactorily when the
regional velocity field is non-linear and specifically when non-uniform
deformation needs to be taken into account. An extended model (e.g.
Denys and Pearson, 2015, Pearson et al., 2015) must be determined that
includes the non-linear deformation. This can be achieved at cGNSS
sites that operate continuously and hence the position can be determined
on a regular basis (e.g. daily positions) and the deformation modelled.
The challenge is how to model the deformation at sites that are not
cGNSS, for example the rover GNSS in a NetworkRTK or an arbitrary site
for which the data is being processed by a processing engine. If
the deformation is uniform, then an interpolation method would be
adequate. Simple interpolation may not work if the deformation is
not regular, either in time or space.
4. TIME SERIES MODELLING OF
DEFORMATION
Time series analysis can be used to model deformation at cGNSS sites.
Denys and Pearson (2015) provides detailed modelling that includes
coseismic events, post-seismic deformation and slow slip events.
Examples are given for the Christchurch events in 2010-2011 (coseismic),
Dusky Sound 2009 (post-seismic and transient velocity) and slow slip
events (Gisborne, Kapiti Coast). Modeling of other common systematic
biases such as seasonal effects (cyclic terms) and equipment changes
(e.g. antenna offsets) has been ignored.
4.1 Coseismic Events
Kaiser et al. (2012) reported the combined geological, geophysical,
seismological, geodetic effects of the Christchurch earthquake. As
shown in Figure 2, four major earthquake events were seen in the cGNSS
sites in the region between epoch 2010.68 and 2011.98 that resulted in a
total horizontal displacement of 150mm (Figure 2).
In Figure 3, the Dusky Sound 2009 event, over 500km away, was
detected (epoch 2009.6). These events are simply modelled by
modifying Equation 1 to include an offset term:
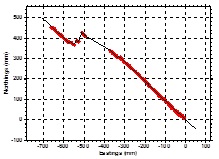 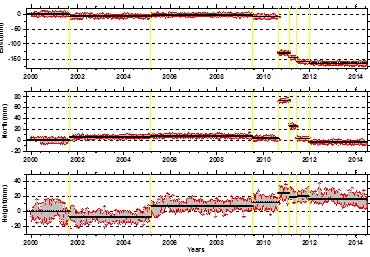
Figure 2: Christchurch 2010-2011 earthquake events. Left:
horizontal plot ; and right times series plots (East, North, Height)..
 (2) (2)
where is the offset (metres) (e.g. coseismic) for the event
(years), and is the number of offset events.
4.2 Post-seismic Deformation Events
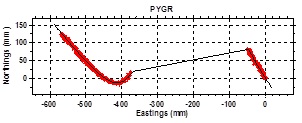 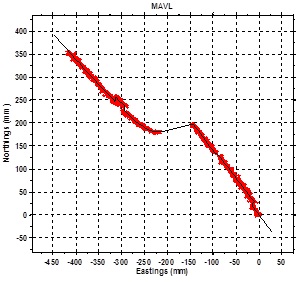
Figure 3: Horizontal plots for cGNSS sites PYGR (top) and MAVL
(bottom).
The maximum horizontal displacement for the Dusky Sound Mw 7.8
earthquake was approximately 1.7 metres. Bevan et al. (2010)
modelled the earthquake coseismic and early post-seismic slip
distribution by inverting the GPS and DInSAR observations. This
data could be the basis of a deformation model that accounts for the
immediate effect of the earthquake, but it is now obvious that the
post-seismic deformation is a significant long term factor.
Although the post-seismic relaxation was very significant (Figure 3,
sites PYGR, MAVL), the velocity of cGNSS sites are up to 3 mm/year
different compared to the pre-earthquake velocity. (In Figure 3, note
the direction of the linear velocity trends pre and post event). The
Mavora Lake (MAVL) site also shows the George Sound event (2007)
(-15mmE, +25mmN) and the effect of a faulty antenna (-300mmE, +250mmN)
(Figure 3).
A decay function is generally used to model the post-seismic
deformation, for example, a logarithmic, exponential, power law or a
combination of the functions (see e.g. Ross et al., 2013). The
function used depends upon the type of deformation and can only be
determined after sufficient position data has been collected. For the
logarithmic function (similar equations can be defined for the
exponential and power law functions), Equation 1 becomes:
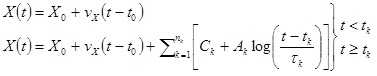 (3) (3)
where is the coseismic offset (metres), is the amplitude of the
post-seismic decay (metres), is the decay time scale (years), the
event time (years) and is the number of events. Similarly,
transient velocity terms can be included such that:
 (4) (4)
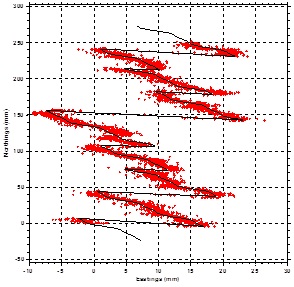
Figure 4: Site GISB showing slow slip events since 2003.
where is the velocity offset (metres), is the transient velocity
(metres/year), is the start time and is the end time of the velocity
event (where may be the end of the time series if the velocity change
is ongoing as is the case for many stations affected by the Dusky Sound
post-seismic relaxation) and is the number of events.
4.3 Slow Slip Events
The Hikarangi trench subduction zone extends south along the East
Coast of the North Island to the top of the South Island. The nature of
the slip along the subduction zones changes from more freely slipping in
the north to less freely slipping (greater coupling) in the south
(Douglas et al., 2005, Wallace et al., 2004). On the surface, this
corresponds to more frequent events lasting a few days to a week in the
north to less frequent events that last months to a year in the south.
An example of a northern site that is affected by frequent SSE is
Gisborne (GISB) (Figure 4). In contrast, further south, around
Wellington and the Kapiti Coast (west of Wellington), the subduction is
deeper and results in events that occur only every 5-7 years but last
for a longer period of time. Figure 5 shows the time series
evolution of seven sites that occupy a region of approximately 100 km ×
50 km with events occurring in 2003, 2008 and 2013. There is a high
level of coherence in the East component with all sites and all SSE
moving to the east (western secular motion, Figure 1). The
amplitude of the SSE varies between sites. Although the amplitude
of the North component is smaller, there is greater variability in the
direction of the SSE between sites.
The SSE can be modelled using the error function with Equation 1
being modified such that:
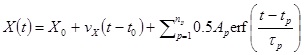 (5) (5)
where is the amplitude of the SSE (metres), is the midpoint of the
event, is the period of the event.
5. REFERENCE STATION COORDINATES
When using NetworkRTK or GNSS processing engines, it is the
deformation events that are time dependent that need further
consideration. In particular, the post-seismic deformation
following a major event (e.g Dusky Sound 2009) and the slow slip events
(e.g. Kapiti Coast). The coseismic deformation is generally a one-off
event and once modelled, can be readily accounted for.
5.1 Dusky Sound 2009 Event
There was significant post-seismic deformation following the July
2009 event. Unfortunately there are only ten cGNSS sites, which
limits the degree to which the deformation immediately after the event
can be modelled. (Ideally, twice that number (20) would improve the
model considerably.) The cGNSS, GNSS campaign data and DInSAR
measurements determined the coseismic deformation (Beavan et al., 2010),
but the post-seismic decay ideally requires more cGNSS sites to model
the spatial distribution. For this event, the post-seismic
deformation was modelled using five years of post-earthquake cGNSS data
and GNSS campaign data from the Central Otago Deformation (COD) network
observed at approximately 6 month intervals (Denys et al., 2014)
Once the immediate post-seismic decay stabilizes, it is clear that
the site velocities are different to the secular velocity prior to the
event. Although the difference in velocity is small (generally < 3
mm/yr), the difference becomes significant over time (e.g. after 10
years, the difference amounts to 30 mm). These changes in velocity
need to be accounted for in Network RTK applications.
In the case of the NDM, an alternative approach was taken where the
immediate post-earthquake deformation is ignored (removed) and therefore
modelled by a single offset term. An additional velocity term is
included to account for the change in velocity.
 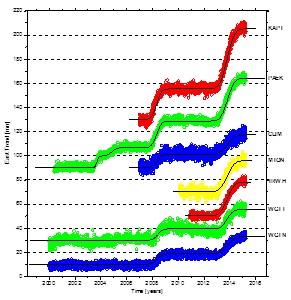
Figure 5: The detrended (velocity) East and North time series of
sites showing up to three long period slow slip events in the Wellington
and Kapiti Coast regions.
5.2 Kapiti Coast Slow Slip Events
Clearly, the velocities at sites affected by SSE may change
significantly over periods of a few days to months at a time. In
such cases NetworkRTK systems that internally determine site velocities
may be grossly in error. This is especially true when the network
does not include sufficient sites that are stable and have reliable
(linear) velocities.
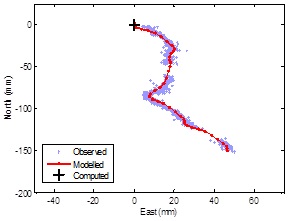 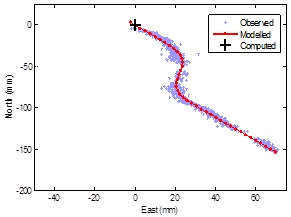
Figure 6: Slow Slip Events on the Kapiti Coast.
Figure 6 shows two sites that are affected by the Kapiti Coast 2013
event. The velocity prior to the event is approximately the long
term secular velocity for each site. However during the event,
which last approximately a year, the direction of the velocity is nearly
90° compared to the long term direction. Following the event, the
direction returns to the long term average, but both sites moved to the
north-east by approximately 50 mm.
As described in Section 4.3, this event occurred on a regional scale.
Models can be created on a site by site basis that allows accurate
reference station coordinates to be extrapolated. Clearly, as this
deformation is ongoing, the model need to be updated on a regular basis
in order to maintain accurate coordinates. How often the model
needs to be updated will depend upon the degree of deformation and the
coordinate accuracy required.
5.3 Rover Positions
The reference station coordinates can be modelled, but the velocities
at locations within active deformation zones may not be able to be
interpolated directly. It cannot be assumed that the velocities of the
reference sites are applicable. Examples include a
kinematic/semi-kinematic rover position or GNSS data being processed by
a GNSS processing engine.
Possible approaches include:
- Apply the secular velocity field.
This ignores any deformation but applies the long term regional
velocity.
- Regional modelling of the spatial
distribution of the deformation e.g. regional grid, Delany
triangulation.
- Regional modelling using a geophysical
model e.g. Okada, TDEFNODE (McCaffrey et al., 2013).
SUMMARY
New Zealand is an ideal natural laboratory to study the effects of
non-linear geophysical processes that affect geodesy and surveying
applications. While there are sophisticated tools to model cGNSS
position time series and correct positions for non-linear processes,
similar techniques are not yet available in commercial software. This
can potentially introduce errors into the coordinates used by the
NetworkRTK reference stations and thus introduce biases in the
coordinates derived using these systems. In addition, New Zealand has
developed a sophisticated National Deformation Model to correct for both
linear velocity fields in plate boundary zones and earthquake
displacements. We do not currently have similar tools to correct for
non-linear processes such as post-seismic relaxation and slow slip
events.
REFERENCES
Argus, D. F., Gordon, R. G., and DeMets, C., (2011). Geologically
current motion of 56 plates relative to the no-net-rotation reference
frame, Geochemistry, Geophysics, Geosystems, 12:Q1101, doi:
10.1029/2011GC003751.
Beavan, J., and Haines, J., (2001). Contemporary horizontal velocity
and strain-rate fields of the Pacific-Australian plate boundary zone
through New Zealand. Journal of Geophysical Research, 106(B1): 741-770.
Beavan, J., Samsonov, S., Denys, P., Sutherland, R., Palmer, N. and
Denham M., (2010). Oblique slip on the Puysegur subduction interface in
the 2009 July MW 7.8 Dusky Sound earthquake from GPS and InSAR
observations: implications for the tectonics of southwestern New
Zealand. Geophysical Journal International, 183: 1265-1286 doi:
10.1111/j.1365-246X.2010.04798.x.
Blick, G., Donnelly, N., Jordan, A., (2009). The Practical
Implications and Limitations of the Introduction of a Semi-Dynamic Datum
– A New Zealand Case Study. Geodetic Reference Frames, IAG Symposium,
International Association of Geodesy Symposia 134: 115-120.
Crook, C. and N. Donnelly (2013). Updating the NZGD2000 deformation
model. Joint Proceedings of the NZIS conference: Celebrating the Past,
Redefining the Future and SIRC NZ 2013 Conference. Ed. Denys, P.,
Strack, M., Moore, A. B. and Whigham, P., Dunedin, New Zealand, New
Zealand Institute of Surveyors: pp40-46.
Darby, D. J., and Meertens, C. M., (1995). Terrestrial and GPS
measurements of deformation across the Taupo back arc and Hikurangi
forearc regions in New Zealand. Journal of Geophysical Research: Solid
Earth, 100(B5), 8221-8232. doi: 10.1029/94JB03265
DeMets, C., Gordon, R. G., Argus, D. F. and Stein, S. (1990). Current
plate motions. Geophysical Journal International, 101(2), 425-478. doi:
10.1111/j.1365-246X.1990.tb06579.x
DeMets, C, Gordon, R. G., Argus, D. F. and Stein, S. (1994). Effect
of recent revisions to the geomagnetic reversal time scale on estimates
of current plate motions. Geophysical Research Letters, 21(20),
2191-2194. doi: 10.1029/94GL02118
DeMets, C., Gordon, R. G., and Argus, D. F., (2011). Geologically
current plate motions, Geophysical Journal International, 181(1): doi:
10.1111/j.1365-246X.2009.04491.x
Denys, P., Norris, R., Pearson, C., and Denham, M., (2014). A
geodetic study of the Otago Fault System of the South Island of New
Zealand. C. Rizos and P. Willis (eds.), Earth on the Edge: Science for a
Sustainable Planet, IAG Symposia 139: 151-158, doi
10.1007/978-3-642-37222-3_19
Denys, P. and Pearson, C., (2015). Modelling Time Dependent Transient
Deformation in New Zealand. In Proceedings of International Symposium on
GNSS (IS-GNSS 2015), 16-19 November 2015, Kyoto, Japan.
Douglas, A., Beavan, J., Wallace, L. and Townend, J. (2005). Slow
slip on the northern Hikurangi subduction interface, New Zealand.
Geophysical Research Letters, 32, (16): L16305. doi:
10.1029/2005GL023607
Haasdyk, J. And Janssen, V., (2012). Site transformations: A block
shift in thinking. In Proceedings of 17th Association of Public
Authority Surveyors Conference (APAS2012), 19-21 March 2012, Wollongong,
Australia.
Grant, D.B., Blick, G.H., Pearse, M.B., Beavan, R.J. and Morgan,
P.J., (1999). The development and implementation of New Zealand Geodetic
Datum 2000. Presented at IUGG 99 General Assembly, Birmingham UK, July
1999
Jordan, A., P. Denys and G. Blick (2007). Implementing localised
deformation models into a semi-dynamic datum. Dynamic Planet -
Monitoring and Understanding a Dynamic Planet with Geodetic and
Oceanographic Tools. P. Tregoning and C. Rizos. Cairns, Australia, 22-26
August 2005. IAG Symposium 130: 631-637.
Kaiser, A., Holden, C.., Beavan, J., Beetham, D., Benites, R.,
Celentano, A., Collet, D., Cousins, J., Cubrinovski, M., Dellow, G.,
Denys, P. Fielding, E., Fry, B., Gerstenberger, M., Langridge, R.,
Massey, C., Motagh, M., Pondard, N., McVerry, G., Ristau, J., Stirling,
M., Thomas, J., Uma, S. R. and Zhao, J., (2012). The Mw 6.2 Christchurch
earthquake of February 2011: preliminary report. New Zealand Journal of
Geology and Geophysics 55: pp67-90, doi 10.1080/00288306.2011.641182.
McCaffrey, R., King, R. W., Payne S. J., and Lancaster, M., (2013).
Active Tectonics of Northwestern U.S. inferred from GPS-derived Surface
Velocities. Journal of Geophysical Research: Solid Earth 118(2):
709-723, doi:10.1029/2012JB009473.
Pearson, C., Denys, P., and Hodgkinson, K., (2000). Geodetic
constraints on the kinematics of the Alpine Fault in the southern South
Island of New Zealand, using results from the Hawea–Haast GPS transect.
Geophysical Research Letters. 27: 1319-1323.
Pearson, C., Crook C., and Denys, P., (2015). The development of a
station coordinate prediction program to model time series from
Continuous GPS stations in New Zealand. IAG Symposia 146, doi:
10.1007/1345_2015_177, in press.
Ross, L. A., Denys, P. H., Williams, C. A., Pearson, C. F.,
Faegh-Lashgary, P., Beavan, R. J., Hamling, I.J. and Townend, J.,
(2013). Post-seismic deformation associated with recent New Zealand
earthquakes. Proceedings of the American Geophysical Union (AGU) 46th
Annual Fall Meeting. Retrieved from http://fallmeeting.agu.org/2013/.
(2013) Poster.
Wallace, L. M., Beavan, J., McCaffrey R. and Darby, D., (2004).
Subduction zone coupling and tectonic block rotations in the North
Island, New Zealand. Journal of Geophysical Research: Solid Earth 109,
B12406, doi: 10.1029/2004JB003241.
Winefield, R., Crook, C. and Beavan, J., (2010). The application of a
localised deformation model after an earthquake. FIG Congress 2010 -
Facing the Challenges – Building the Capacity. Sydney, Australia.
BIOGRAPHICAL NOTES
Paul Denys: I have been an academic staff member at the School
of Surveying, Otago University since 1995. I teach papers in Survey
Methods and Survey Mathematics. My primary interest is GNSS positioning
and geodetic data analysis with a focus on active deformation. New
Zealand offers an excellent opportunity to study and understand the
broad scale deformation of the Australian-Pacific plate boundary as well
as focusing on specific problems: Central Otago and Cascade
deformation, Southern Alps uplift and sea level rise. I have also
been involved with the geodetic analysis of the Christchurch earthquake
sequence and its application to the maintenance of the geodetic
infrastructure.
Chris Pearson: Since 2011 Chris has been a lecturer/research fellow
at School of Surveying, Otago University where he has been active in
measuring earth deformation and has collaborated with LINZ to develop
tools such as PositioNZ-PP and made contributions to the NZGD2000 datum.
Prior to this he worked for the US National geodetic Survey where he was
project lead for maintaining the US National Deformation Model. Chris is
currently acting as an advisor to the Government of Nepal on modernizing
their national datum.
CONTACTS
Dr. Paul H. Denys
School of Surveying,
University of Otago
PO Box 56
Dunedin
NEW ZEALAND
Tel. +64 3 4797596
Fax +64 3 4797586
Email:
pdenys@surveying.otago.ac.nz
Web site:
www.otago.ac.nz/surveying
|


